
Safer Routes to School
Overview
Safer Routes to School generates a safety score for every public school based on the pedestrian routes available to students, allowing users to compare schools on a compound score of risky driving behavior, student populations in need, and number and size of crossings. Scores can illuminate which schools may need more attention and how that's changing over time. Within each school, the application identifies the fastest routes from up to the top 5 generalized student home locations, as well as a safer alternative for each route.
Key Features:
- Nationwide coverage of public school districts and public schools graded by safety of top routes to school
- One fastest pedestrian route for up to the top 5 generalized student home locations for each school, following pedestrian facilities where available
- A safer route alternative for each origin, optimized for the Safety Score Weights applied by the user
- Five safety objectives to optimize against:
- Risky driving behavior at intersection crossings along the route (including harsh braking, distracted driving, and excessive speeding)
- Vehicle lanes at crossings along the route
- Number of crossings along the route
- Households at the origin with no access to private automobiles
- Households at the origin that are below the Federal Poverty Level
- Route-level exposure metrics: driver behavior events at each route's crossings visualized
Safer Routes to School in Action
The application is organized into four views, from statewide rankings down to an individual route:
-
State view. Compare school districts in the state: Every school district in the selected state receives a safety score and districts are ranked from least to most safe. Rankings include school districts where students' five most common home areas are within 3 miles of their school.
-
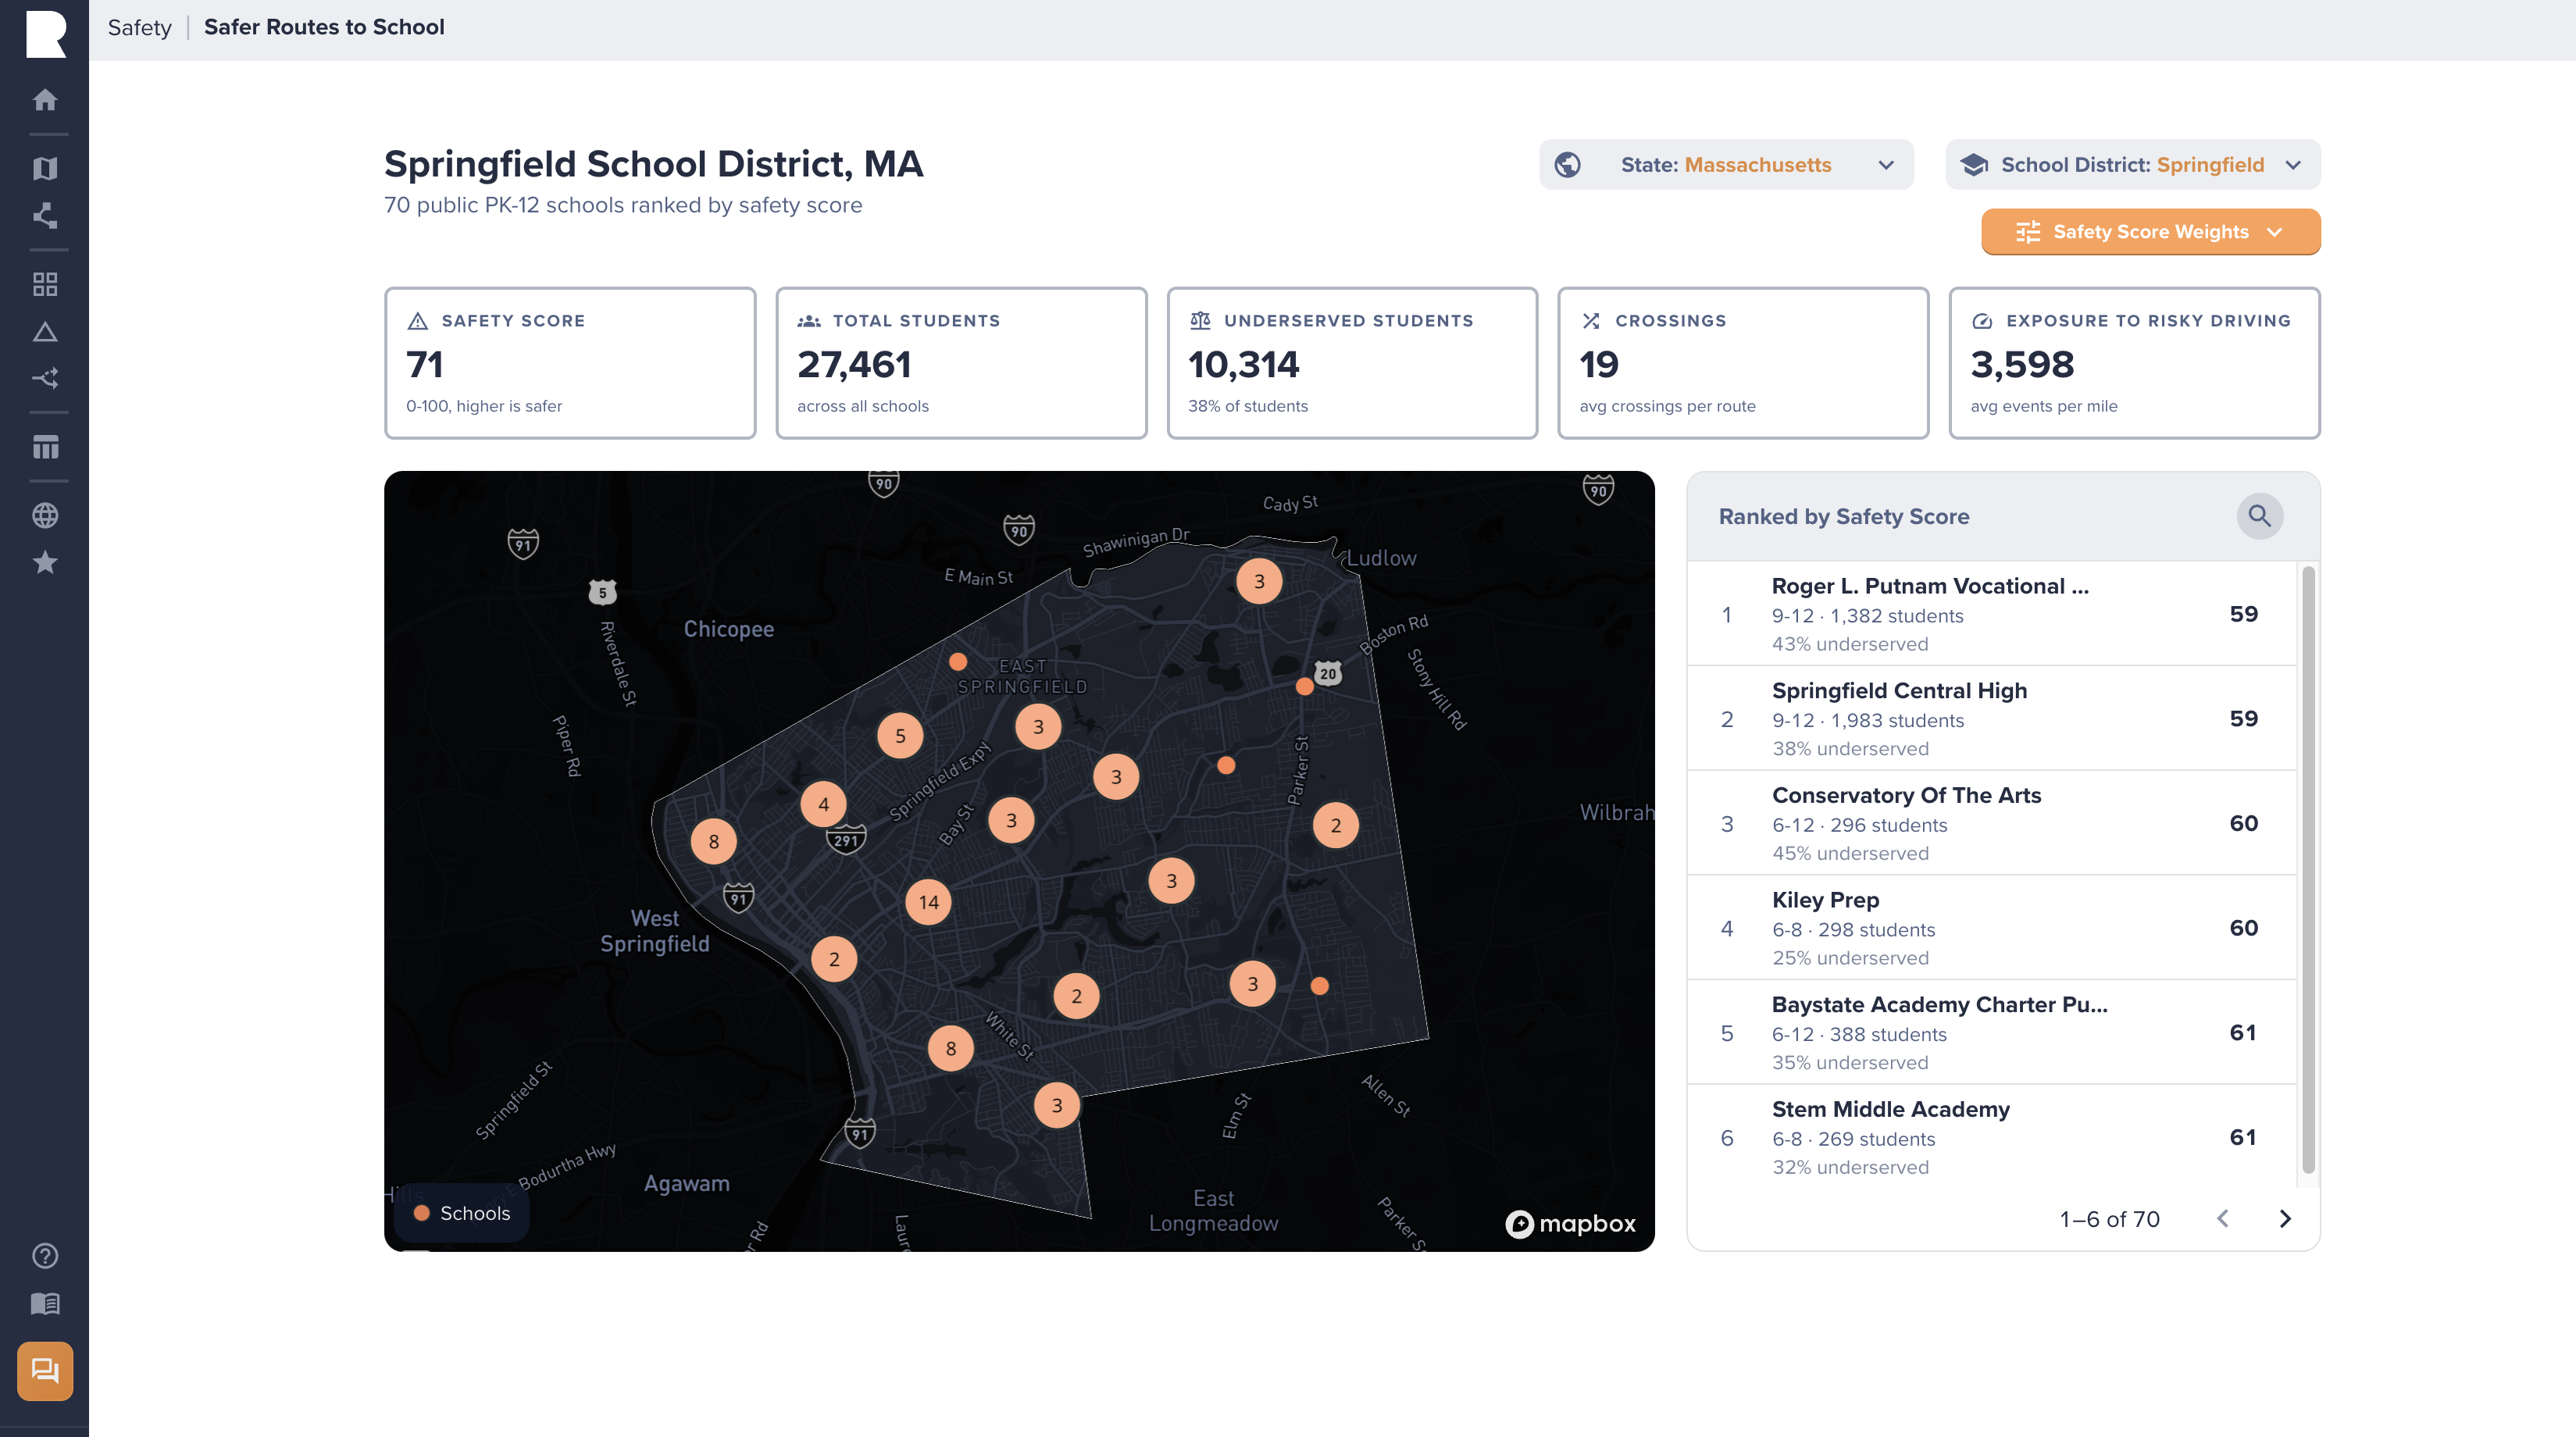
District view. Compare schools within the district: Every school in the selected district receives a safety score, and schools are ordered by least to most safe average route. Rankings include schools where students' five most common home areas are within 3 miles of the school.
-
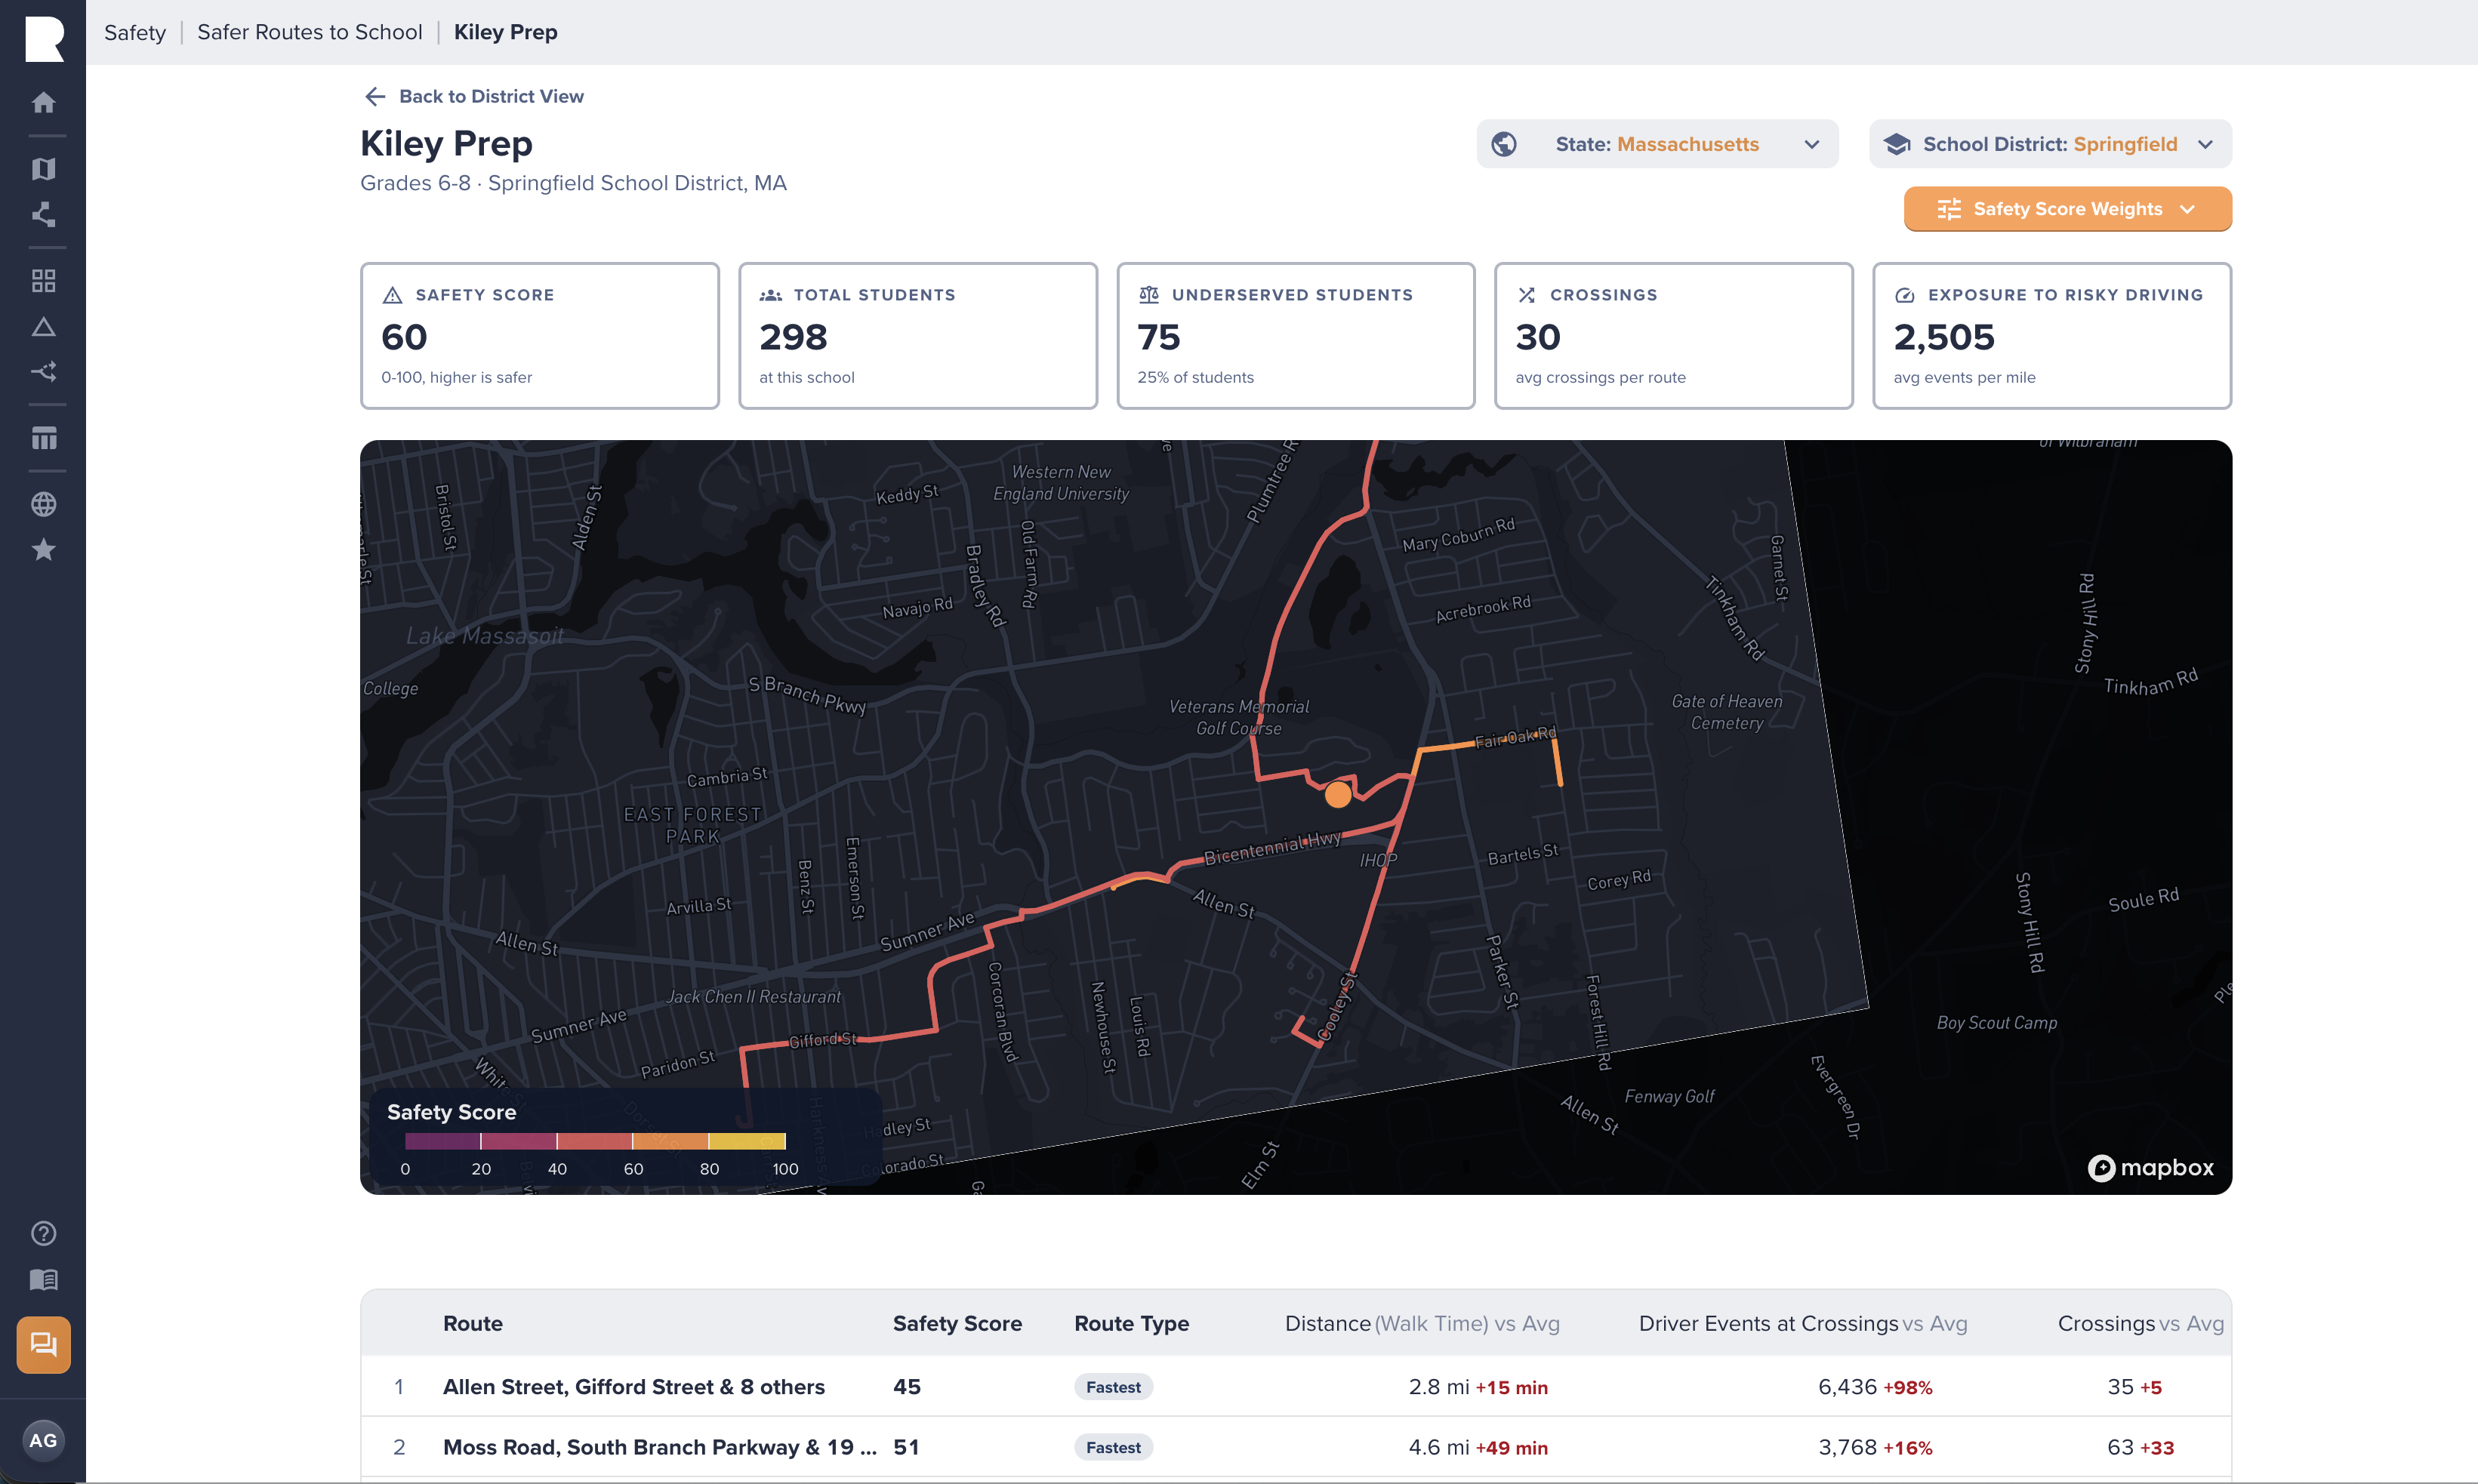
School view — compare and prioritize routes: Routes include the fastest routes from up to the top 5 generalized student home locations. Top 5 generalized student home locations are defined as the center points of block groups that contain at least 10 students enrolled at the school. Routes prioritize walking facilities where available. Routes can be ranked by any combination of safety exposure, students served, and crossings, to help illuminate the route most in need of attention.
-
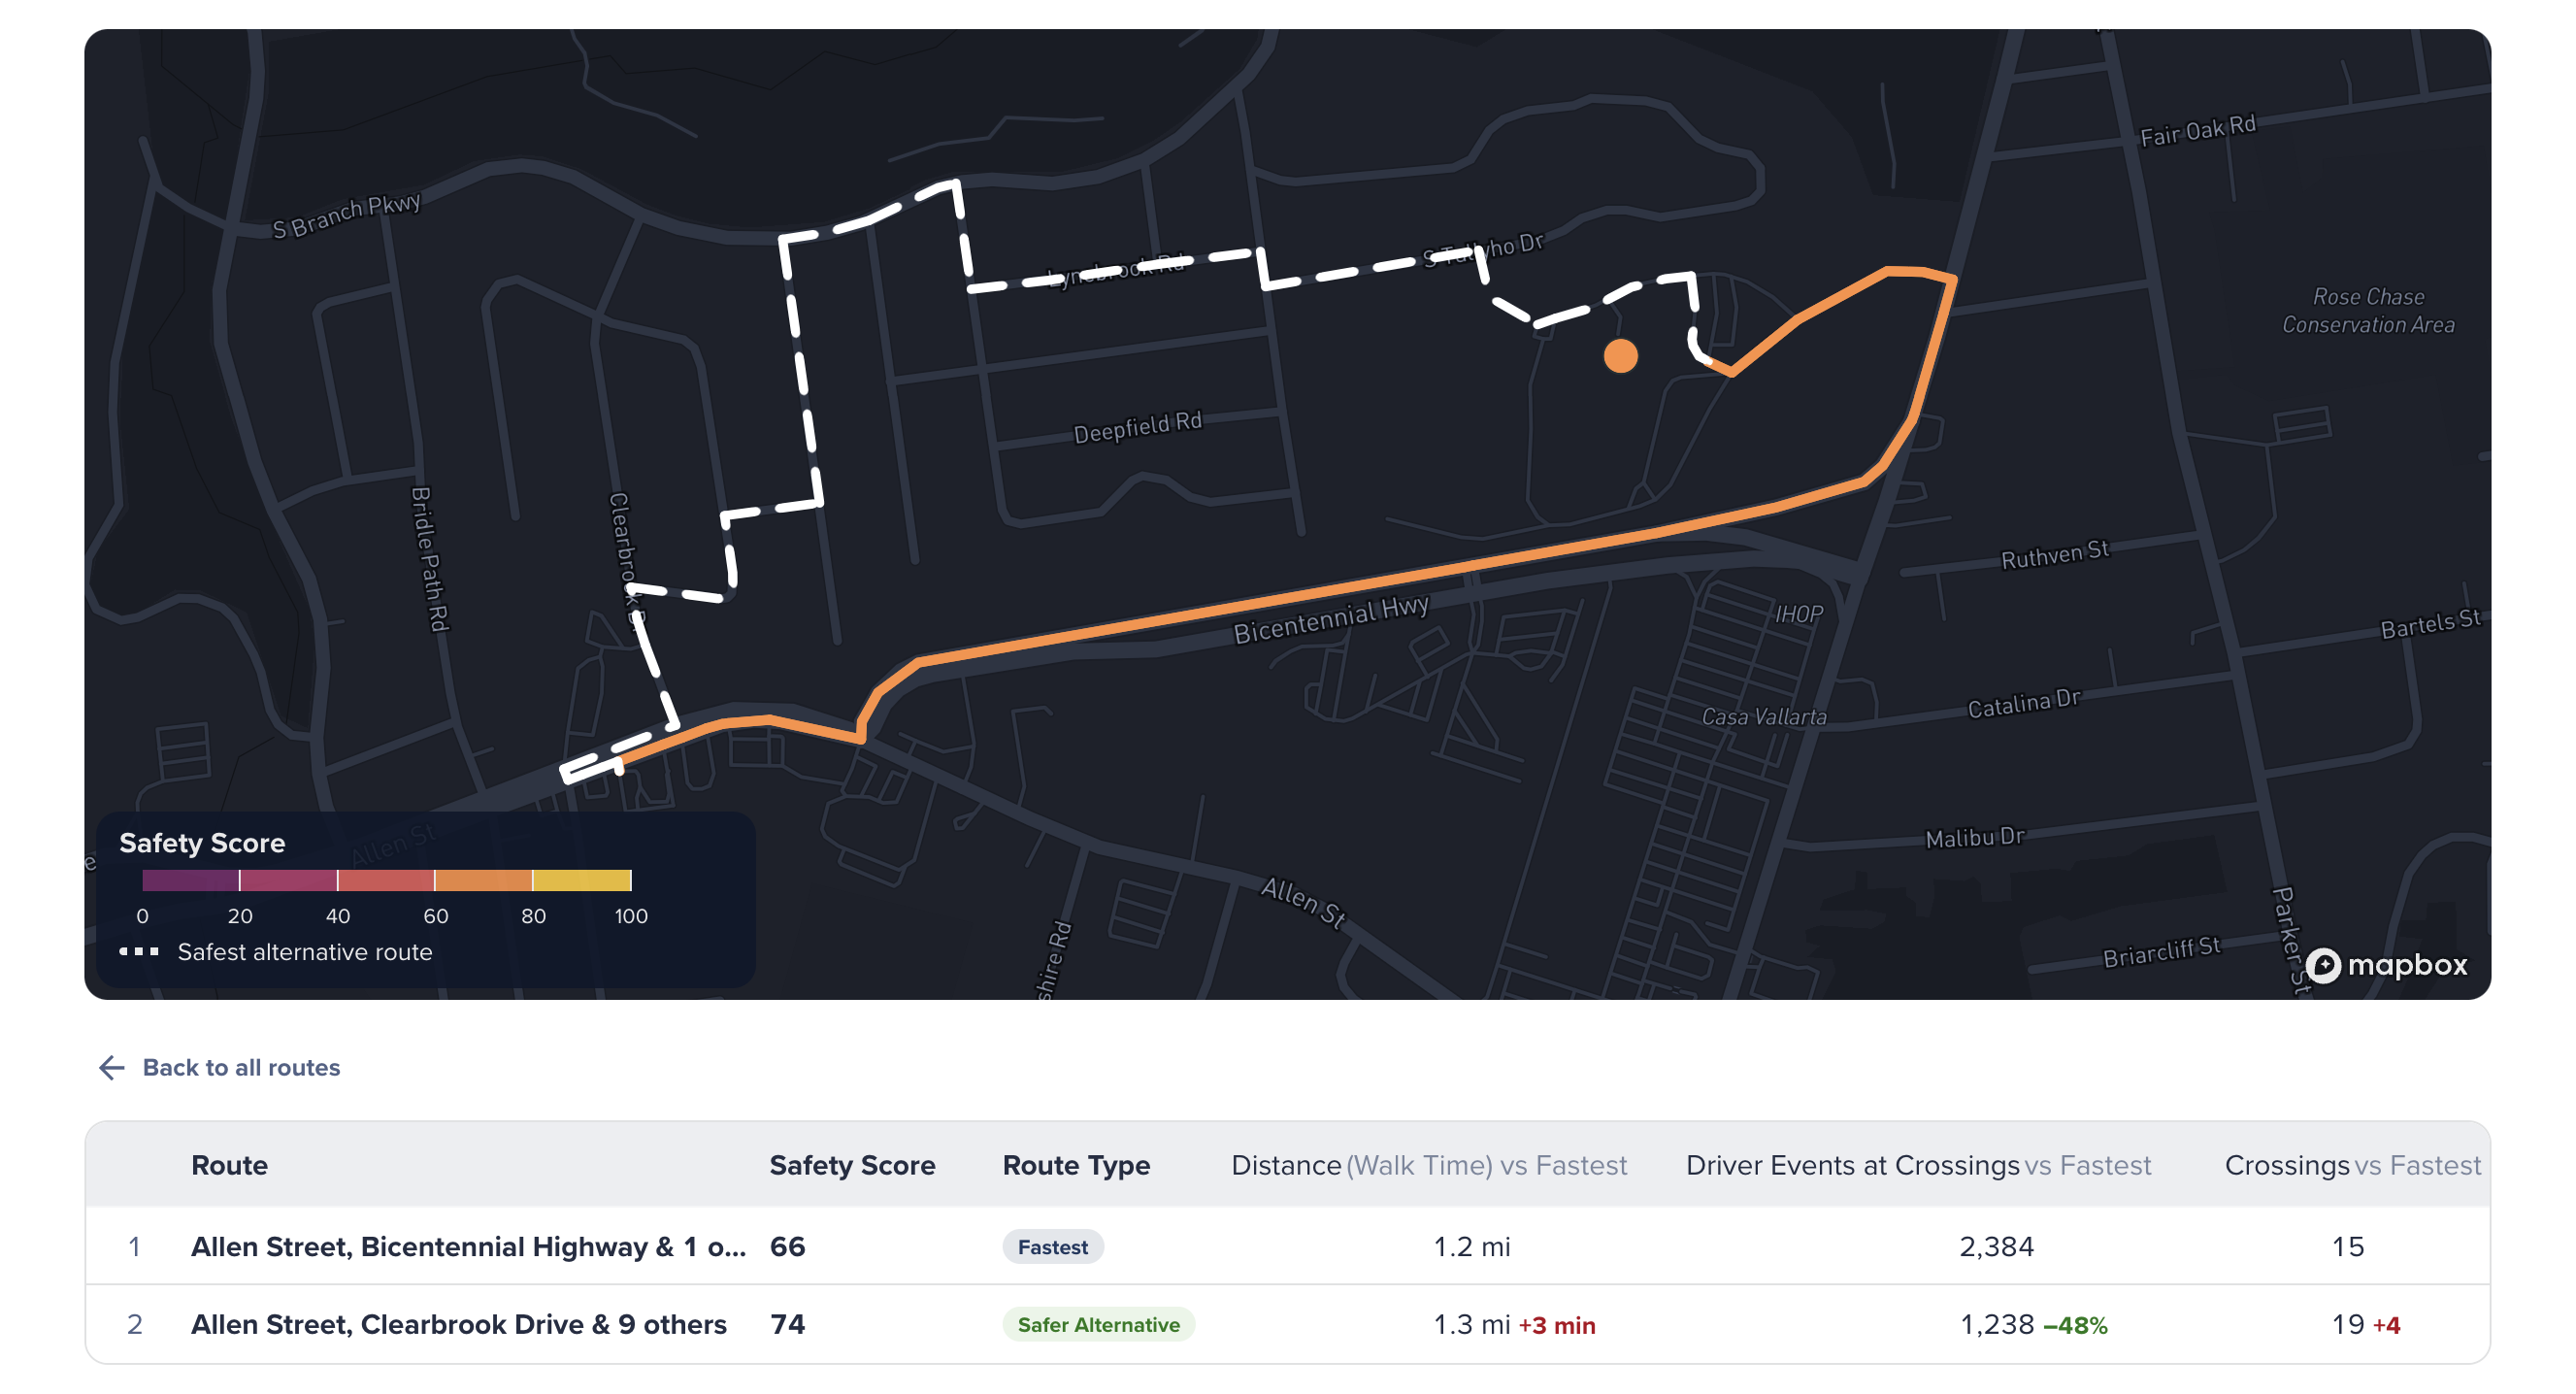
Route view — identify safer alternatives: Selecting a route isolates it on the map. The fastest route from a top generalized student home location is shown, along with a safer alternative optimized for the Safety Score Weights applied.
Methodology
Route generation runs in three stages: assigning safety context to the national walking network, generating routes, and scoring each route with exposure and student metrics.
Safety-Weighted Network
Every node and edge of Replica's national street network is assigned safety context. Three driver behavior event measures; harsh braking, distracted driving (phone handling), and excessive speeding (20+ mph over the limit) are scaled to daily averages and attached to every road segment and intersection, alongside physical attributes: road class, lane counts, drivable length, and whether pedestrians are permitted. Driver behavior events are sourced from Replica's driver behavior data for Fall 2025; see Driving Behavior Data Methodology for full details.
A pedestrian is exposed to traffic at each intersection or junction they cross. Junction-level values include the driving activity on streets crossed.
Each school and each origin block group is then snapped onto the walking network, preferring real walkable routes and junctions, and every school is paired with the origin block groups within a 3-mile straight-line radius.
Origin Selection and Coverage
Each school's routed origins are its top generalized student home locations: the center points of the block groups that contain at least 10 students enrolled at the school, ranked by student count, with up to 5 origins per school. Schools with fewer than 5 qualifying block groups are routed from as many as qualify.
Coverage in the application's rankings follows a walkability threshold: a school is ranked when its top generalized student home locations are within 3 miles of the school, and a school district is ranked when its schools' student home areas meet the same 3-mile test. Schools and districts outside these thresholds are excluded from rankings rather than scored on routes few students would plausibly walk.
Route Generation
Routes are generated per school on a pedestrian graph of the surrounding network. Edges are weighted by attractiveness rather than raw length; quieter road classes are preferred, car-free links are discounted, and links without pedestrian access are heavily penalized, so routes prioritize walking facilities where available and the fastest route reflects where a pedestrian would actually choose to walk, not just the geometrically shortest path.
The fastest route is the shortest attractiveness-weighted path from the origin to the school. Each safer alternative then solves a constrained optimization: minimize one safety objective summed along the path, subject to the path's weighted length exceeding the fastest route's by no more than a detour budget of 25%. In other words, if the fastest, realistic route is a mile in length, the optimization solves for the safest alternative up to an additional 25% (or a quarter mile) in length. Five objectives are optimized independently: number of street crossings, harsh braking, distracted driving, excessive speeding, and drivable lanes crossed.
The fastest route is always evaluated as a candidate, so a safer alternative is never worse than the fastest route on its own objective. The safer alternative surfaced in the application is the candidate that best satisfies the Safety Score Weights applied by the user. The safer alternative has a maximum additional travel time of 5 minutes (1/4 mile) or 20% more than the fastest route, whichever is greater.
Route Scoring
Every distinct route is scored with a family of exposure metrics. Metrics describe the junctions or crossings the walk passes through: driver behavior events at each crossing, the number of junctions where at least one drivable street must be crossed, and the total lanes crossed, with the two legs of a street running through a junction counted as a single physical crossing.
Each route's scores also include student two counts: students in zero-vehicle households and students in households below the federal poverty level (using income thresholds by household size).
Sources
Public school names, locations, and enrollment are sourced from the National Center for Education Statistics (NCES) Common Core of Data (CCD), the U.S. Department of Education's annual directory of the country's public elementary and secondary schools. Each school's CCD record supplies its name, street address, total enrollment, and grade span. Because the CCD directory does not include coordinates, each school's location is geocoded from its street address and then matched to campus boundaries and building footprints, so routes terminate at the school's physical location. Grade spans are translated into the range of student ages each school serves.
Students are ascribed to a specific school using Replica's representative population of U.S. residents, in which each person's school attendance is derived from the Census Bureau's American Community Survey. Each student is matched to a school through a gravity model: candidate schools near the student's home are filtered to those serving the student's age, then weighted by enrollment size and proximity, with a strong preference for public schools in the student's own school district. Students are assigned down their ranked preferences iteratively, with each school admitting students only up to its NCES-reported enrollment, so every school fills in proportion to its actual size and students attend schools consistent with where they live.
Updated 6 days ago