
Annual Speeds Data
Overview
Replica provides two speed-related datasets on an annual cadence: free-flow speed per network link, and a quarter-hourly speed profile per network link. Both datasets are produced with the same methodology.
Quality Metrics
Benchmarking
Comparison to New York City 2021 Traffic Camera Speed Data
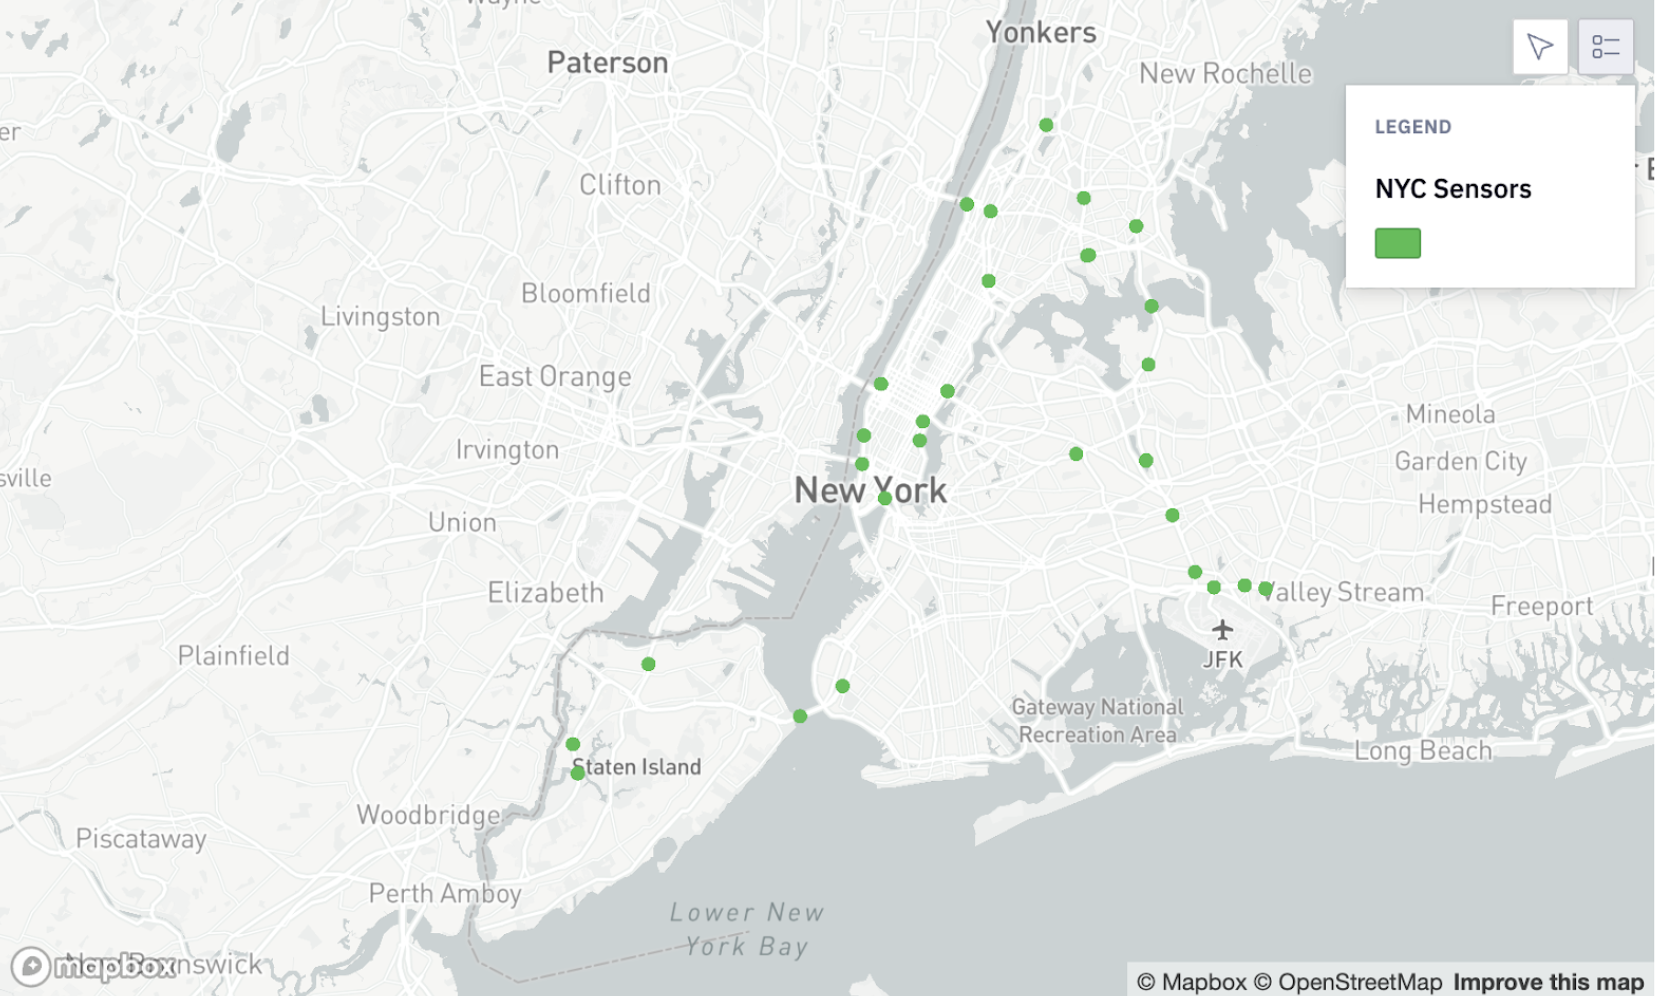
We compare our quarter-hourly speed profile to New York City traffic camera speed data, averaged over the same collection period. This speed data is publicly available for download on the NYC Open Data Portal. Traffic camera speed data is analogous to our method, as cameras record the average speed between two points on a roadway via the elapsed time between them. The locations compared are shown on the map below.
Location of Comparison Points between NYC Traffic Camera data and Replica's Quarter-hourly Speed Profile
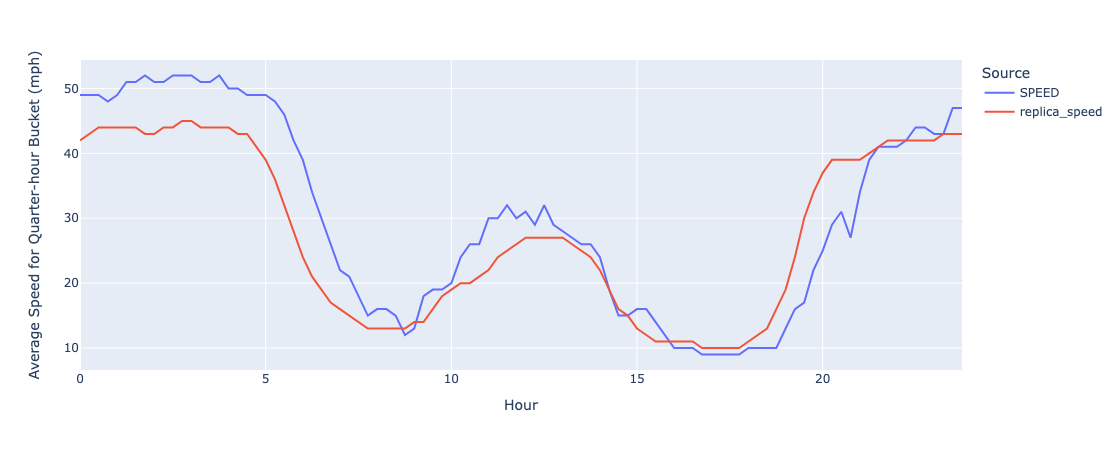
Below is a comparison between the time-averaged traffic camera data (“SPEED”) with the Replica quarter-hourly speed profile (“replica_speed”) on a section of the Trans-Manhattan Expressway (I-95), for a typical Tuesday.
Comparison between NYC Traffic Camera data and Replica's Quarter-hourly Speed Profile for one location
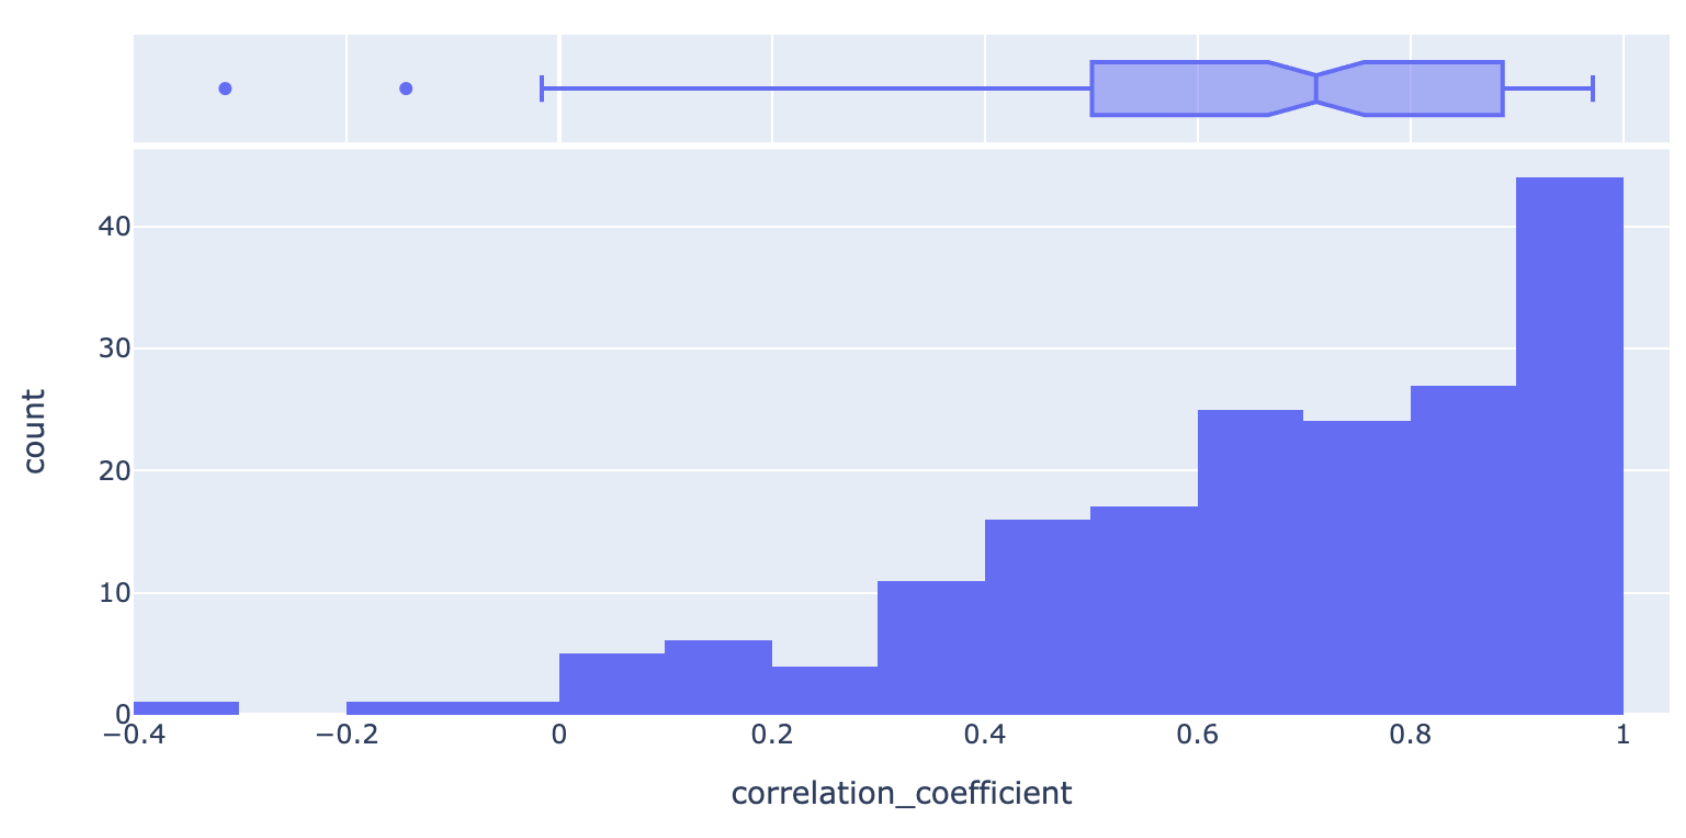
The histogram below shows the distribution of correlation coefficients computed between the Replica quarter-hourly speed profile and the traffic camera speeds time series on a per-location, per-day-of-week basis. The bulk of the two time series panels are strongly correlated, with a median correlation coefficient of 0.71.
Histogram of correlation coefficients between NYC Traffic Camera data and Replica's Quarter-hourly Speed Profile
Methodology
Replica's speed data is derived from a commercial probe-based traffic dataset, which aggregates GPS measurements from a large panel of connected vehicles. Data is collected over the full calendar year for annual speed products.
Speed values represent sample-weighted averages of pre-aggregated traffic statistics. In addition to mean speed, 50th, 85th, and 95th percentile speeds are provided for each road segment and time interval. Because speeds are derived from probe vehicles traversing the network rather than from point-based sensors, they reflect the effective travel speed along a link—the relevant measure for constructing travel time tables—rather than instantaneous speed as measured by radar.
The speed data is aggregated to produce both the annual speeds per network link and the quarter-hourly speed profile per network link tables. Speed data for a given quarter-hour is not reported when the observed probe sample size falls below a minimum threshold. This most commonly affects overnight hours, when traffic volumes—and therefore the number of probe observations—are lowest.
Updated 2 months ago