
Safe Streets Planner Overview and Methodology
Overview
The Safe Streets Planner provides a comprehensive solution for assessing and prioritizing high-risk corridors and generating detailed reports.
This application combines our detailed multimodal data and driving event data, enabling you to map existing conditions, analyze specific corridors, and generate safety action plans and reports. By fusing metrics like speeding, hard-braking, and distracted driving with data on mobility activity and demographic information, this application empowers agencies to identify, prioritize, intervene, and monitor impacts on high conflict corridors in their communities.
Key Features:
- Customize parameters for high-risk corridors.
- Rank corridors by risk percentage.
- Analyze driver events and assess vulnerable road user information per corridor.
- Evaluate the effectiveness of prioritized corridors in resolving conflicts.
- Communicate and collaborate with project team members directly within the application
- Create an action plan for sharing with stakeholders and integrating into project deliverables.
Safe Streets Planner in Action
The application includes the following components:
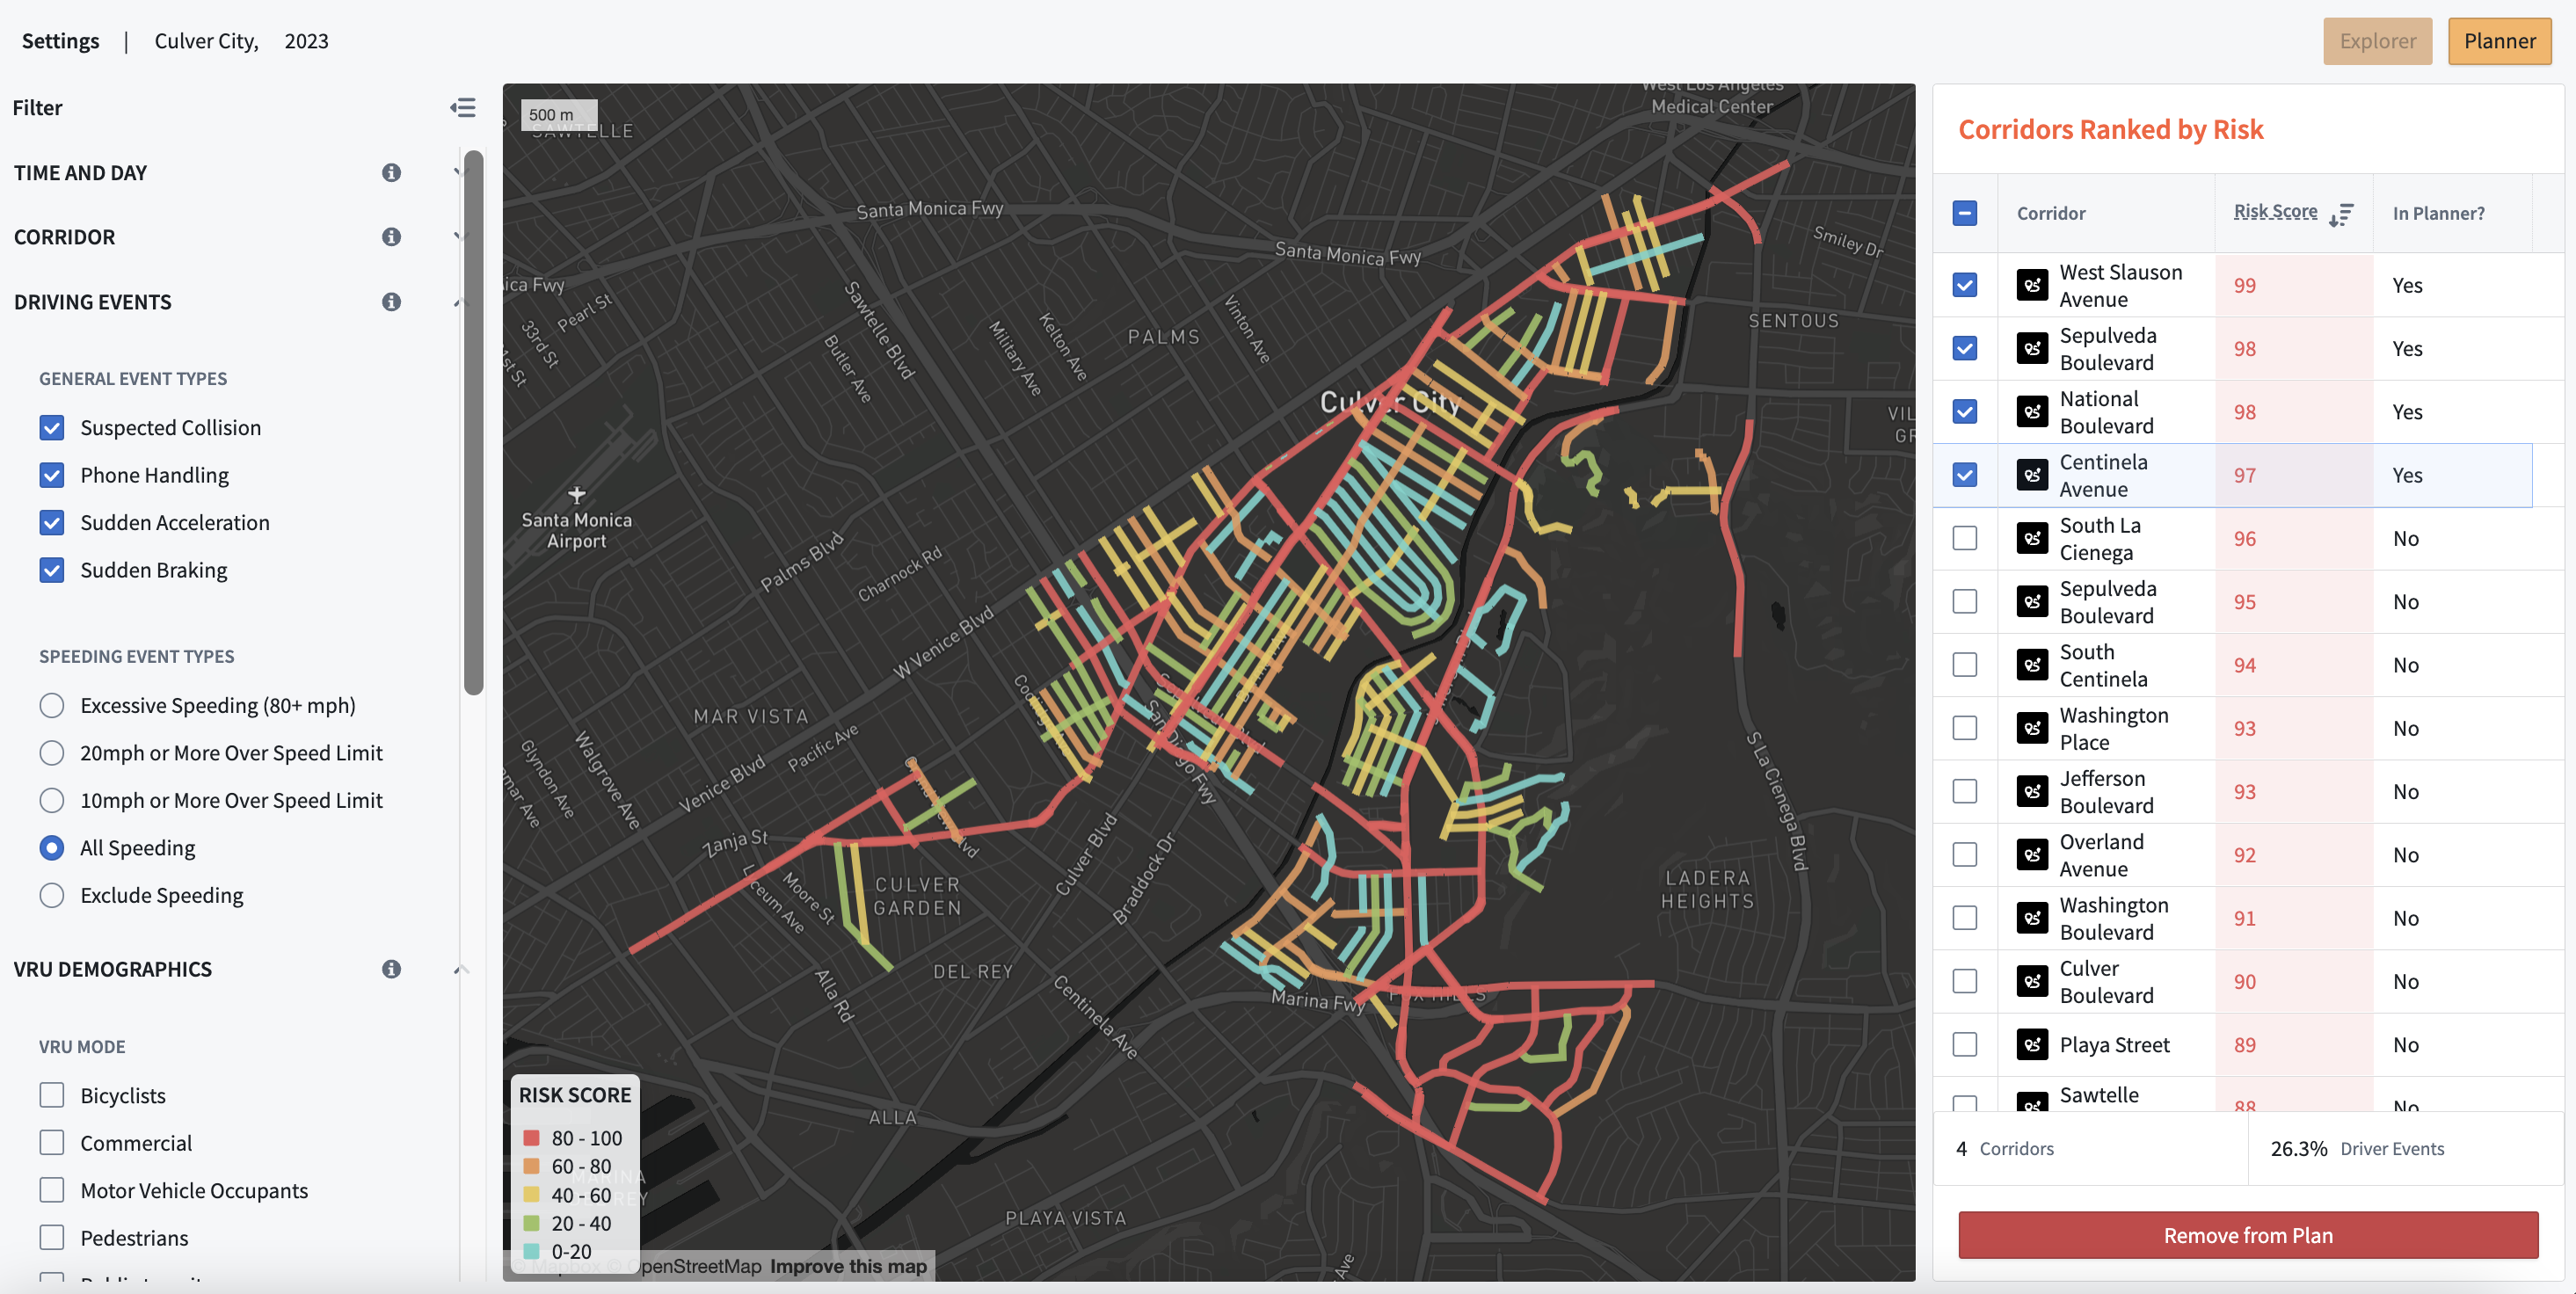
- Explore View: Customize risk score parameters to visualize, explore, and prioritize corridors. See a ranked list of corridors by risk.
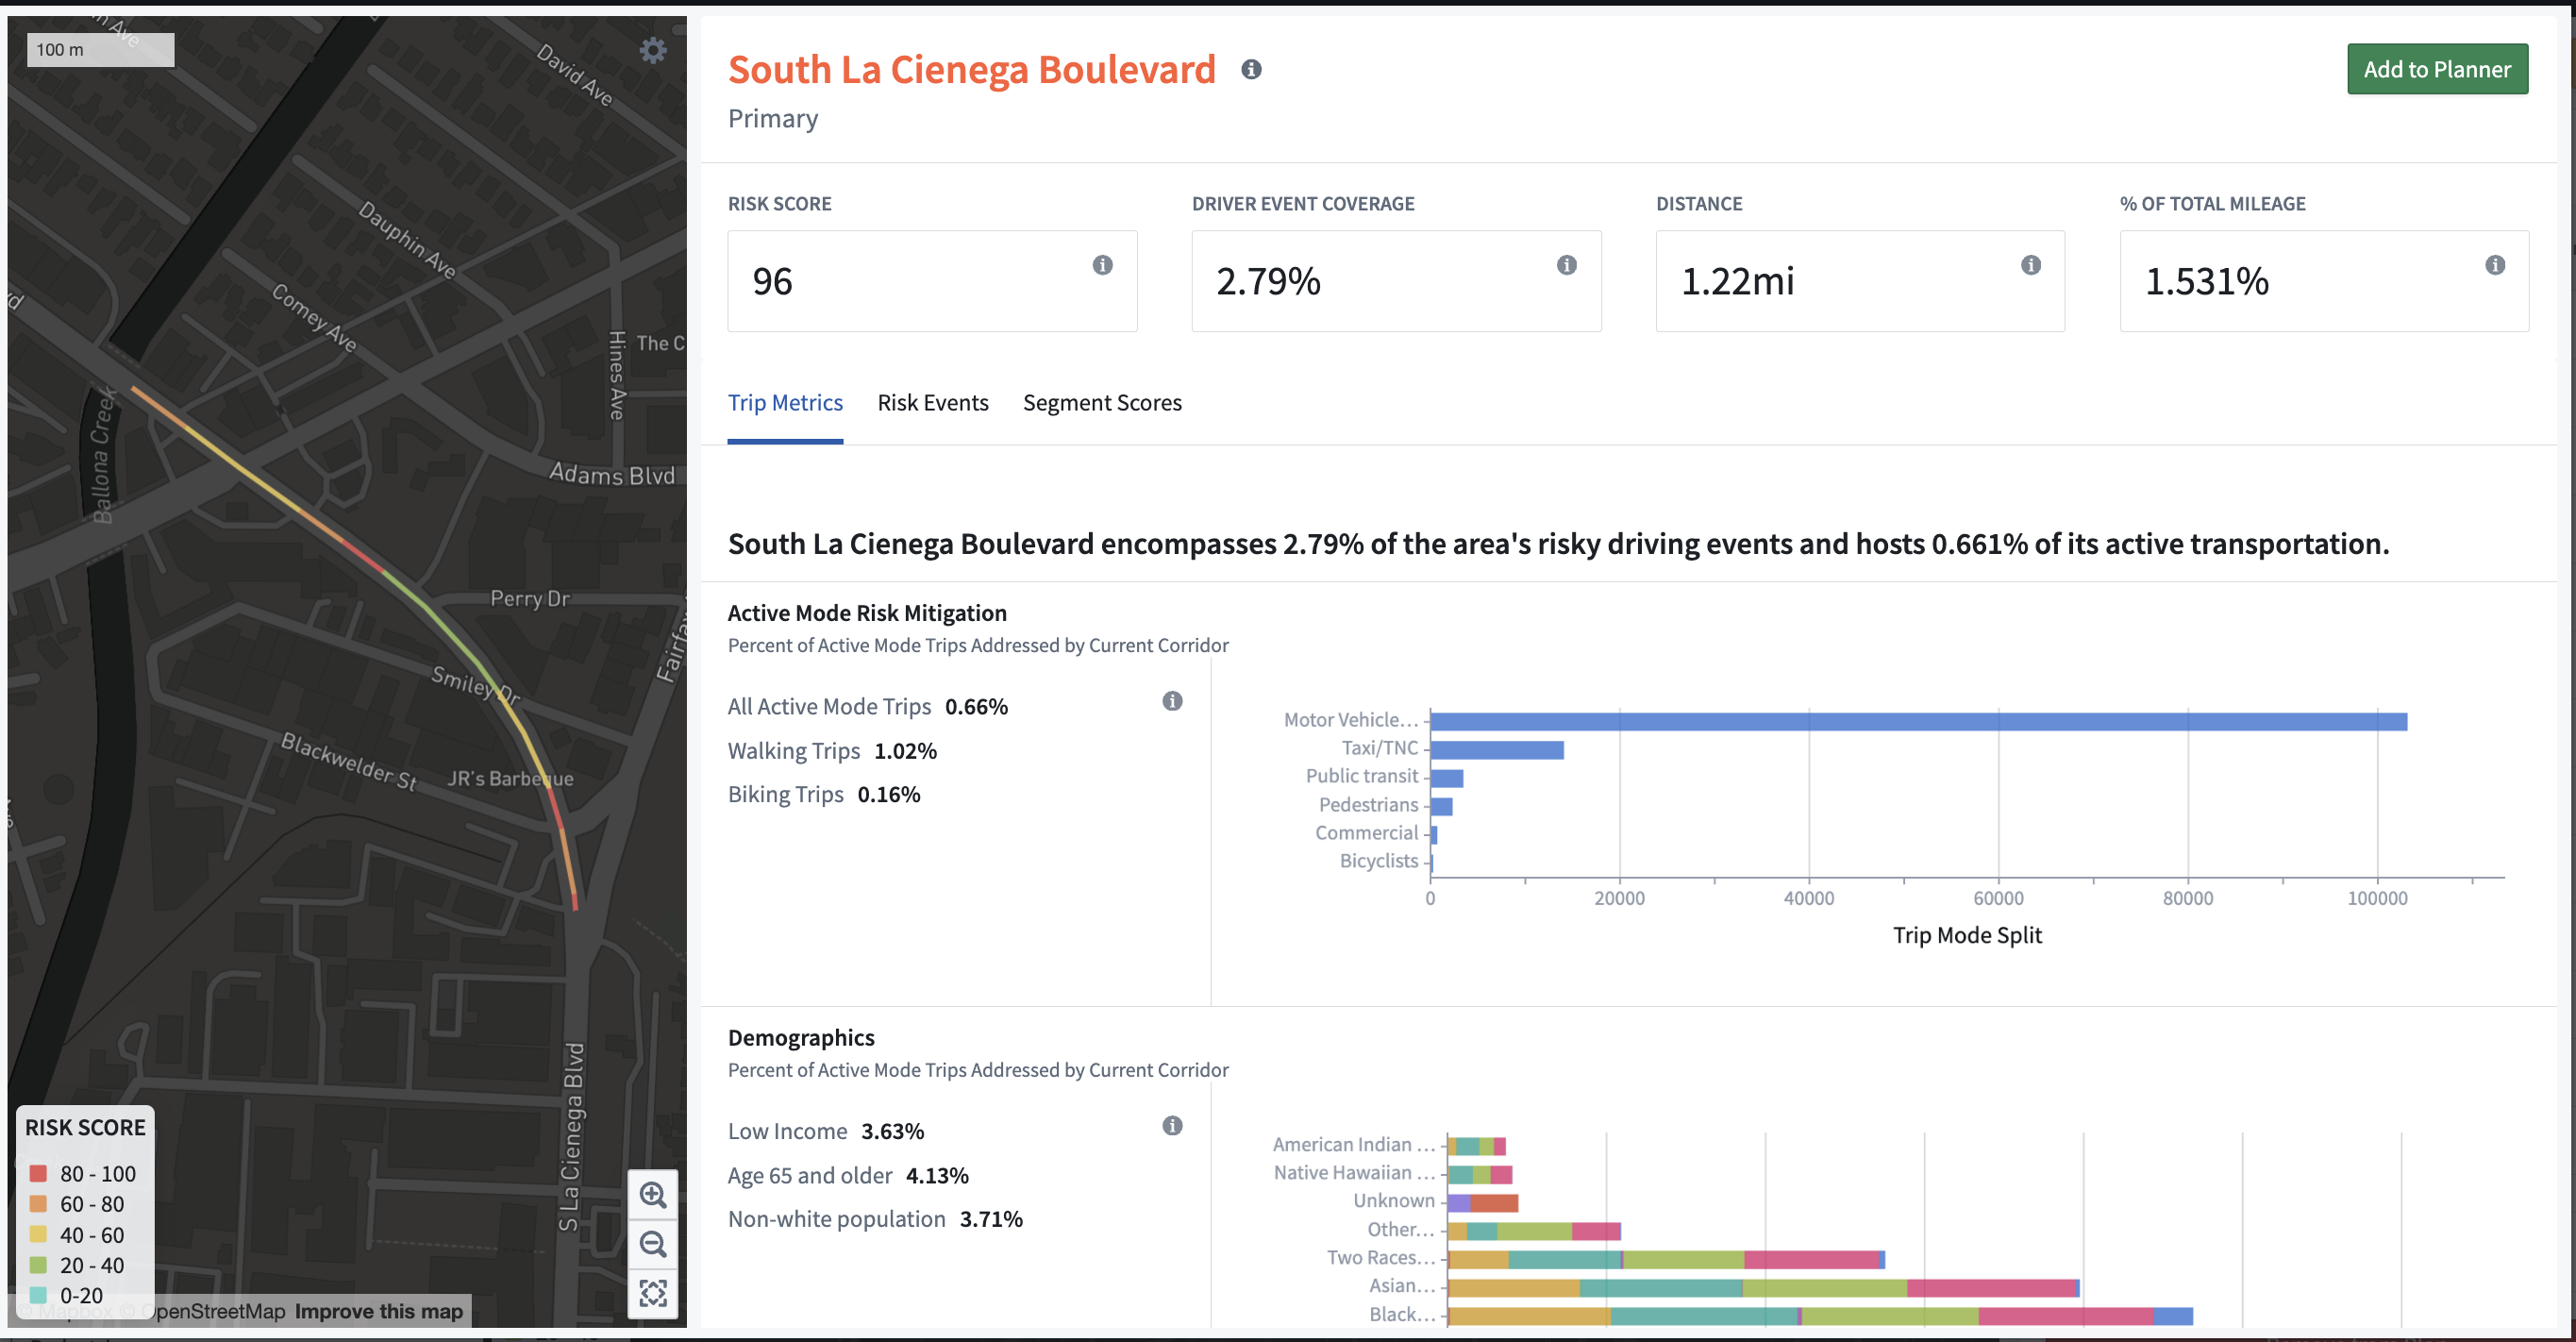
- Corridor-Focused View: Select individual corridors from the map to see a comprehensive breakdown of their risk score components, pinpointing specific areas of concern.
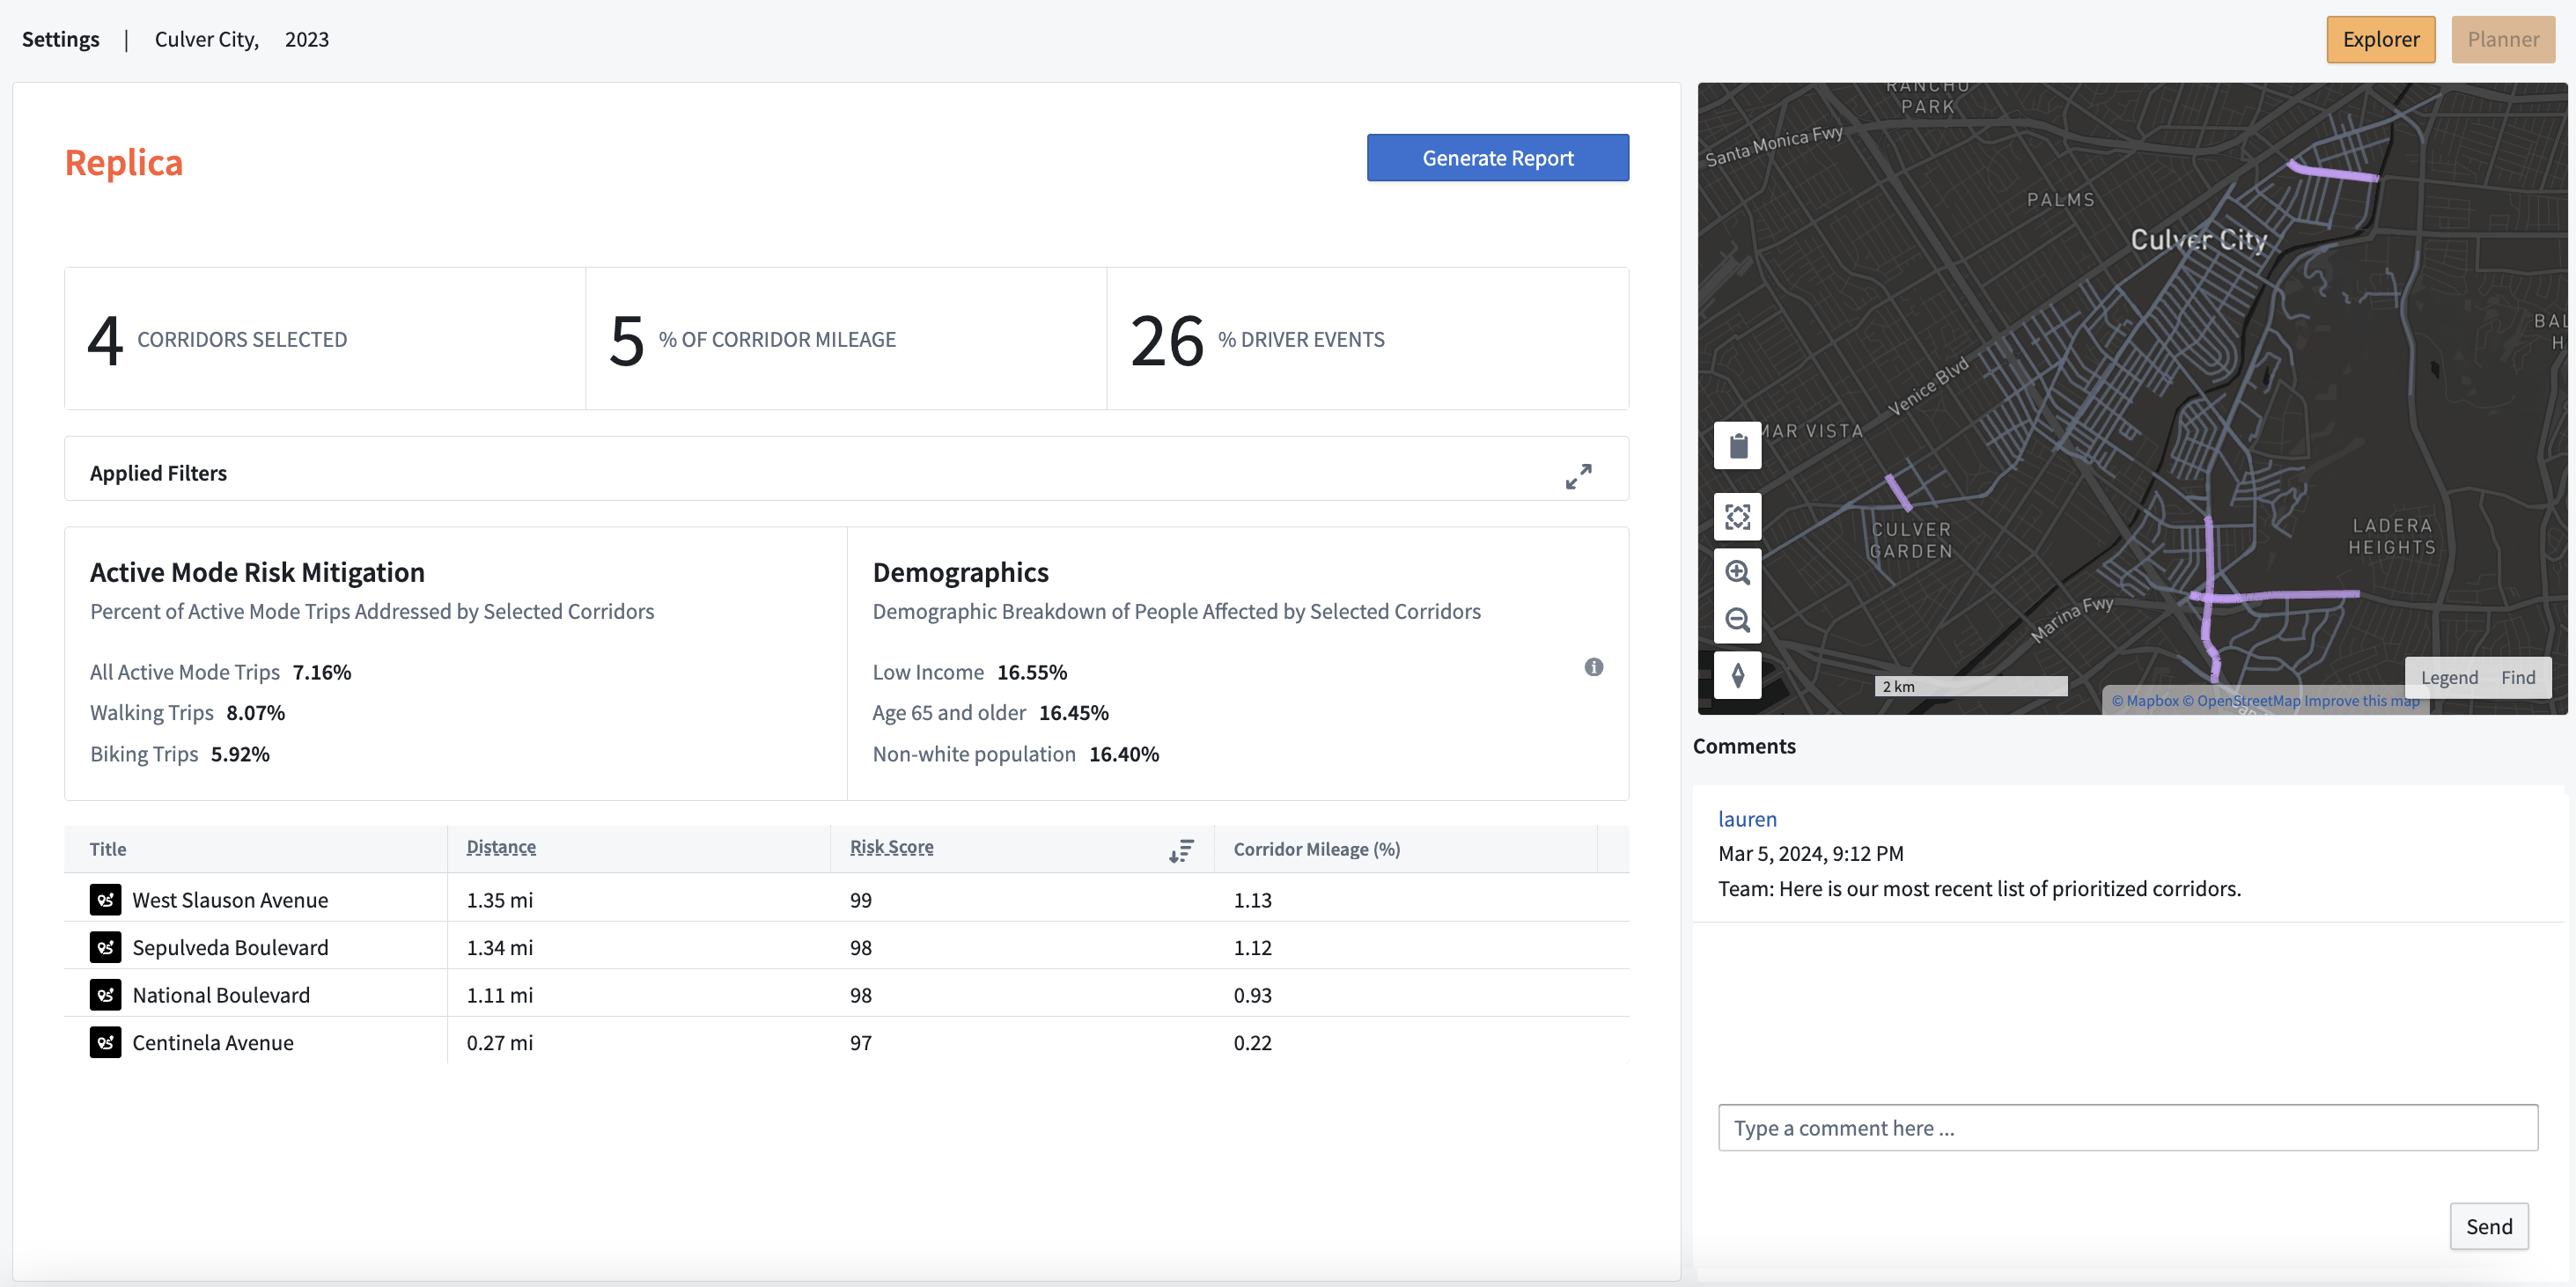
- Planner View: Strategically prioritize high-risk corridors, collaborate with project teams, and develop action plans for sharing with stakeholders and integrating into project plans.
Methodology
Risk Scores
The Safe Streets Planner incorporates both observed driver event data and Replica's mobility and demographic data to assign risk scores to corridors and segments in a given area. Risk scores are generated using the following logic:
- For each corridor or segment, we multiply "total trips" (filtered) × "total driver events" (filtered) = risk potential
- To normalize, we divide by the corridor's or segment's mileage = risk potential per mile
- We then rank by percentile:
Corridors: Ranked against all other corridors (0-100)
Segments: Ranked against other segments within the same corridor (0-100)
Driver Event Data
The driver data included in the risk score is sourced from traffic analysis data. They capture anonymous driver behavior from over 40 million connected drivers nationwide, including events such as:
- Suspected Collision
- Phone Handling
- Sudden Acceleration
- Sudden Breaking
- Speeding Events
- 10mph or More Over Speed Limit: Detected when speed is 10mph or more over speed limit.
- 20mph or More Over Speed Limit: Detected when speed is 20mph or more over speed limit.
- Excessive Speeding (80mph+): Detected when speed exceeds 80 mph.
For each event, data including time, location, GPS coordinates, and speed is captured and contextualized by weekday or weekend. All driver event data is then integrated with OpenStreetMap’s (OSM) network for segment-level aggregation.
Mobility and Demographic Data
The total trips data included in the risk score is based on modeled mobility and demographic data from Replica’s seasonal (Places) dataset. This data is generated by running large-scale, computationally intensive simulations. To create Places models, Replica sources a composite of data sources and follows the below steps:
- Create a synthetic population that matches the characteristics of a given region
- Train a number of behavior models specific to that region
- Run simulations of those behavior models applied to the synthetic population in order to create a “replica” of transportation and economic patterns
- Calibrate the outputs of the model against observed “ground-truth” to improve quality
The output of this dataset includes detailed trip and population tables for a typical weekday and weekend day in a given season. Each trip is assigned a set of attributes, including start and end times, origin and destination information, primary mode, trip routing behavior, and, and trip-taker demographics.
More detailed information about the process Replica follows to create these models can be found below:
Seasonal Mobility Model Methodology (Summary)
Seasonal Mobility Model Methodology (Extended)
This data allows filtering by trips traveling through specific road segments, and is also joined to OSM’s roadway network. This facilitates seamless integration with driver event data.
Risk Score Filters
Set custom parameters for your risk analysis in the Filter Panel. See below for a full list of filters and their definitions:
| Filter | Definition | Values |
|---|---|---|
| Time and Day | The day and time in which driving events and trips occur. | Day: A typical weekday or weekend day in the selected season (e.g., Spring 2023). Time: 24-hour period |
| Corridor: Network Link Type | The roadway classification of a given corridor. | These are based on OpenStreetMap (OSM) roadway classifications. |
| Driving Events | Driver behavior occurring on a given corridor. | Suspected Collision: Detected when there is a sharp spike in accelerometer followed by a major deceleration. Phone Handling: Identified when using the phone’s gyroscope, accelerometer as well as unlocking function. Sudden Acceleration: A sudden increase in speed beyond a certain threshold for a certain time. Sudden Breaking: A decrease in accelerometry above a certain threshold for a certain time. Speeding Events: See definitions for each category below: 10mph or More Over Speed Limit: Detected when speed is 10mph or more over speed limit. 20mph or More Over Speed Limit: Detected when speed is 20mph or more over speed limit. Excessive Speeding (80mph+): Detected when speed exceeds 80 mph. |
| Vulnerable Road Users (VRU) Mode | Mode of travel used by vulnerable road users on a corridor. | Bicyclists: Trips made by bicycles. Replica does not model scooter trips and does not separate out e-bike trips. Commercial: Trips made by medium and heavy trucks: Motor Vehicle Occupants: Trips made by drivers or passengers of private auto vehicles. Pedestrians: Trips made by people walking. Public Transit: Trips made by surface-mode public transit vehicles (buses). Rail ridership would not fall into this category as we assign rail ridership to a transit-specific network rather than OpenStreetMap (OSM) network. |
| VRU Age | Age of vulnerable road user on a corridor. | Example: Over 65 |
| VRU Household Income | Household income of vulnerable road user on a corridor. | Example: $25,000 - $50,000 |
| VRU Race and Ethnicity | The race and ethnicity of vulnerable road users. | These categories are defined by the Census: American Indian and Alaska Native Non-Hispanic/Latino: A person having origins in any of the original peoples of North and South America (including Central America) and who maintains tribal affiliation or community attachment. Asian: A person having origins in any of the original peoples of the Far East, Southeast Asia, or the Indian subcontinent including, for example, Cambodia, China, India, Japan, Korea, Malaysia, Pakistan, the Philippine Islands, Thailand, and Vietnam. Black Non-Hispanic/Latino: A person having origins in any of the black racial groups of Africa. Terms such as "Haitian" or "Negro" can be used in addition to "Black or African American." Hispanic or Latino Origin: A person of Cuban, Mexican, Puerto Rican, South or Central American, or other Spanish culture or origin, regardless of race. The term, "Spanish origin," can be used in addition to "Hispanic or Latino." Native Hawaiian and Other Pacific Islander Non-Hispanic/Latino: A person having origins in any of the original peoples of Hawaii, Guam, Samoa, or other Pacific Islands. White Non-Hispanic/Latino: A person having origins in any of the original peoples of Europe, the Middle East, or North Africa. |
Updated 8 months ago