
Transit Equity and Demand Scores Overview and Methodology
Overview
The Transit Demand & Equity Scores application provides insights that can empower you to make data-driven decisions that shape the future of public transit in their communities. It contains two distinct scores:
Transit Demand Score:
Answers questions about where demand for service is highest and where it would be most utilized if made available.
This score is a quantitative measure of predicted demand for transit services in a given geography. It ranges from 0 to 100, with 100 being the highest level of demand. The scores are generated using a random forest regression model that considers several relevant factors within a selected area, such as the number of residents, number of workers, households with zero automobiles, transit commuters, and median household income.
Transit Equity Score:
Consider the locations of existing stops to answer the question, “How well does a city’s existing public transit system serve the portion of the community that is most dependent on transit day to day?”
This score assesses the level of equity in transit services as measured by the proportion of users who are travel-burdened within an area of interest. In this approach ‘travel burdened’ is defined by metrics such as income level, number of cars per household, commute duration, worker industry types, and minority populations. The equity model assigns values between 0 and 100 to each transit stop within the selected geography. Stops with a score of 100 are considered to be the highest priority locations with respect to delivering equitable services.
Methodology
Transit Demand Methodology
The transit demand scores are created as outputs from a random forest regression model that processes the input data into a set of normalized values ranging between 0 and 100, where 100 represents highest demand. These scores are calculated for and assigned to H3 level-8 cells for the study area that is selected by the user. For this version of the demand model, we’ve chosen to start with H3 level-8.
The Random Forest Regression model used to predict the number of transit trips in each H3 cell is based on five independent variables, or ‘features.’ All of the features used in the analysis are derived directly from Replica’s Places data for the chosen season of interest. The features included in this version of the model include the following:
| Feature Name | Description | Assumption |
|---|---|---|
| n_residents | The number of residents in each H3 cell. | The number of people living in each cell directly influences number of trips generated, including transit trips. |
| n_workers | The number of workers in the H3 cell. | Number of people working in a cell also influences transit demand because workplaces attract many trips, including transit. |
| n_zero_auto_hh | The number of households with zero automobiles in a H3 cell. | Zero-auto households are a strong indicator of transit demand. |
| med_income | The median income of households in the H3 cell. | Household income is correlated with transit usage, e.g., lower income households are more likely to use or need transit options. |
| n_transit_commuters | The number of transit commuters apportioned to the H3 cell. | The total estimated transit commuters is a direct indicator of transit demand from the census which we can draw from to inform demand within our model. |
During the modeling process importance metrics are generated to inform the model about the relative impact each feature has toward predicting transit demand. These metrics, which include the gain, cover, and weight, can be made available to customers for their requested model run if requested.
Initial testing of the demand model was conducted for San Francisco, New York City, and Chicago to determine how well the model predicted transit demand. The results from these test runs are quantified below with the set of performance metrics generated from each city’s model run:
| Metro/City | R^2 | Mean Absolute Error | Median Absolute Error | Explained Variance |
|---|---|---|---|---|
| San Francisco | 0.84 | 80.2 | 46.1 | 0.84 |
| New York City | 0.95 | 154.7 | 52.0 | 0.95 |
| Chicago (Cook County) | 0.85 | 9.63 | 1.6 | 0.85 |
An overall R^2 within the range of .84 to .95 indicates that this version of the model is adequately predicting demand. As reflected by the resultant metrics from our test cities, the performance of the model will vary by city or region based on their size and local characteristics.
The following graphic shows the resultant demand predictions made for San Fransisco.
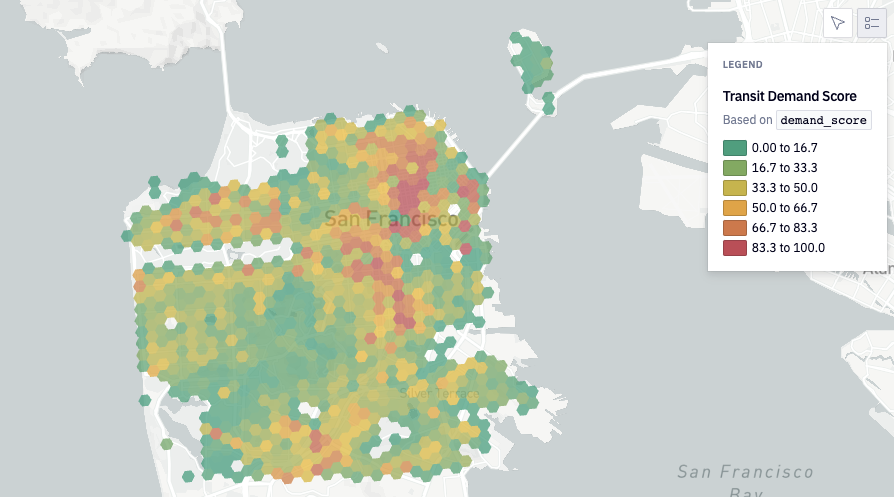
Map showing Replica Transit Demand Score in San Francisco (Fall 2022)
As a final note, the model may produce duplicate predictions for some cells within a study area (i.e., some cells will have the same demand value). This is a function of the relatively small number of input features currently used by the model. Adding additional features into the model within future iterations will likely increase predictive accuracy and differentiation within a study area. We are currently exploring the inclusion of additional features for future releases such as: land use characteristics, total travel demand, and distance from existing transit stops.
Transit Equity Methodology
The equity model examines which travelers are utilizing each transit stop within a study area, enriches each stop with specific variables from Replica’s Places data, and then uses the results to assign each stop an equity score. The variables used by the model to produce the equity scores include the following:
-
Median Household Income of Transit Riders - The median household income of all transit riders in the selected geography is broken into quintiles, and each transit stop gets a score of 1 to 5 based on the quintile within which its median household income falls. Transit stops serving the lowest income population quintile receive a score of 5. Transit stops serving the highest income quintile receive a score of 1.
-
Minority Population - The percentage of non-white users are computed for each transit stop and a score of 1 to 5 is assigned based on the quintile breakdown of the non-white population at all stops in the selected geography. Transit stops serving the highest proportion of minority populations (e.g., Black, Asian, American Indian/Alaska Native, etc.) receive a score of 5. Transit stops serving the lowest proportion of minority population receive a score of 1.
-
Industry of Employment - Industry of employment was included in the model to account for areas where public transportation is critical for connecting workers that are less likely to work from home. We currently use the two-digit NAICS codes from our population data to exclude workers from industries where work from home is more likely. The industries excluded from consideration by the model are listed below:
NAICS Code Description NAICS54 Professional, Scientific, and Technical Services NAICS52 Finance and Insurance NAICS51 Information NAICS92 Public Administration NAICS53 Real Estate and Rental and Leasing NAICS55 Management of Companies and Enterprises For each stop, the percentage of riders who do not work in these industries is computed and grouped into quintiles. A score of 1 to 5 is assigned to each stop based on the corresponding quintile group. Transit stops serving the highest proportion of these workers receive a score of 5. Transit stops serving the lowest proportion of these workers receive a score of 1.
-
Commute Time - Longer commute times can disproportionately affect certain communities, especially those with limited access to other transportation options. For each stop, the model computes the average trip time for riders using the stop for a work trip purpose. Next, the averages for all of the stops in the geography are broken into quintiles. A score of 1 to 5 is assigned to each transit stop based on the average commute time of that stop and its corresponding quintile group. Transit stops serving the highest proportion of long commute times receive a score of 5. Transit stops serving the lowest proportion of long commute times receive a score of 1.
-
Zero Auto Households - This factor was included to assess whether transit services adequately serve households without a car. First we determine what proportion of travelers from zero-auto households are using a given transit stop, and then we group the stops into quintiles based on these zero-vehicle usage proportions. A score of 1 to 5 is assigned to each stop based on its corresponding quintile group. Transit stops serving the highest proportion of travelers from zero-auto households receive a score of 5. Transit stops serving the lowest proportion of zero auto households receive a score of 1.
A raw equity score is assigned to each transit stop based on the sum of the scores obtained from the five individual variables incorporated by the model. The lowest possible raw equity score a transit stop can receive is 5. The highest possible equity score is 25. To ensure consistent interpretation and comparability, the raw scores are then normalized into a range between 0 and 100, where 100 equals the equity score.
The graphic below shows the results of the equity model run against the transit stops in San Fransisco.
")
Map showing Replica Transit Equity Scores in San Francisco (Fall 2022)
Shapefile Data Dictionary
Shapefiles require that the field names be less than 10 characters. Hence the following column names are used in the replica transit scores shapefiles.
Transit Demand Score
| shapefile column | Description |
|---|---|
| geo_name | name of hex cell |
| raw_id | id of hex cell |
| geometry | wkt geometry |
| n_resident | number of residents in cell |
| n_workers | number of workers in cell |
| n_zero_aut | number of zero auto households in cell |
| med_income | median household income in cell |
| n_trn_comm | number of transit commuters in cell |
| demand_sco | transit demand score |
Transit Equity Score
| shapefile column | Description |
|---|---|
| stop_id | id of transit stop |
| inc_quint | income quintile of transit stop users |
| race_quint | non-white race quintile of transit stop users |
| ind_quint | industry of employment quintile of transit stop users |
| time_quint | commute time quintile of transit stop users |
| zaut_quint | zero auto households quintile of transit stop users |
| equity_sco | transit equity score |
Updated 8 months ago