
Active Transportation Planner Overview and Methodology
Overview
The Active Transportation Planning App (ATP) allows users to view cycling, walking, and latent demand for active transportation infrastructure at a census block group, network/corridor, and county level. Users select and save a potential or existing infrastructure project, such as a bike lane, sidewalk, intersection redesign, and the app analyzes the potential VMT, CO2e, and traffic impacts of the infrastructure project. The app will also calculate aggregate metrics on a user selected neighborhood, and prioritize corridors in that neighborhood based on latent demand (i.e. short passenger automobile trips utilizing that corridor).
Key Features:
- Calculate current biking, walking, and short passenger automobile trips (aka latent demand) utilization of a corridor or network link and in the surrounding network
- Calculate VMT, CO2e, and traffic impacts of proposed cycling and walking infrastructure projects based on latent demand and a mode shift from driving to active modes, both directly on the corridor and in the surrounding network
- Explore maps and prioritized lists of neighborhoods and corridors based on latent demand for mode shift to cycling and walking
- Compose a comprehensive infrastructure plan, visualizing and measuring impact of integratated project proposals, and triage for the highest impact projects
- Collaborate on the infrastructure plan with other users in your organization
- Metric parameters such as latent demand trip length, indirect effects buffer distance, and mode shift percentage are user configurable
Getting Started
- Create an analysis for saving and exploring corridors and projects. You will be prompted to set the geography, which will limit the scope of the data, and provide baseline comparison metrics
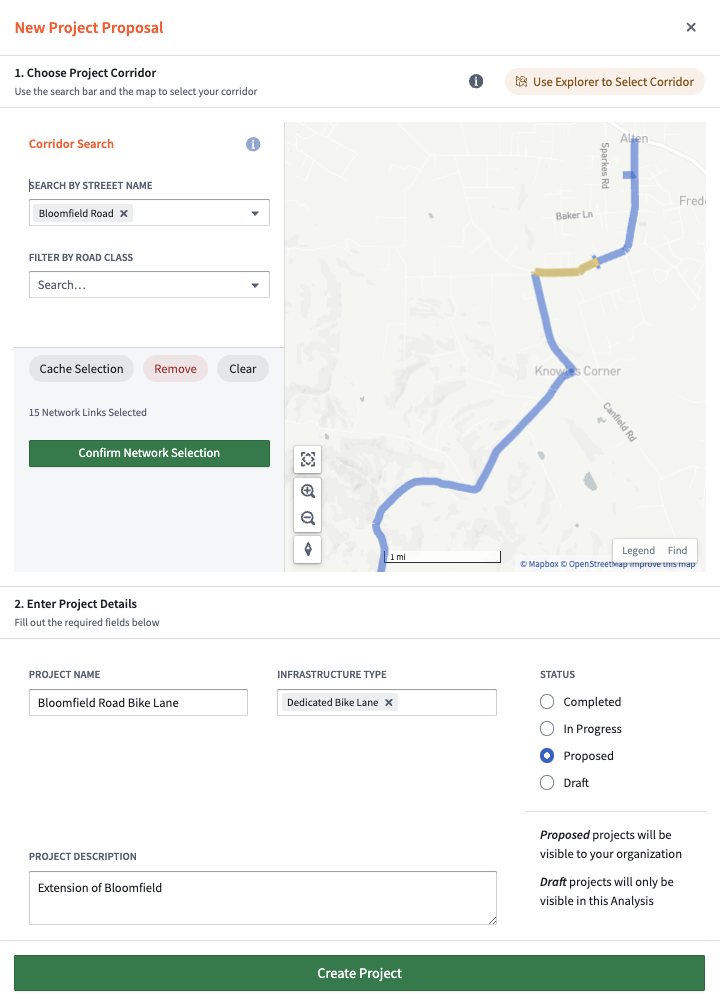
- Select your First Project by searching by street name, then shift + click and drag to select the segment of your street where you’d like to assess a project. Ultimately, the selection in yellow is what will be assessed as a “Project”. You can adjust your selection with “cache selection” to hold the selection in yellow, “remove” to remove selected segments, and clear to remove all the selection. If you don’t know what project to select, click “Use Explorer to Select Corridor” to prioritize which corridors you want (see Explorer View Below).
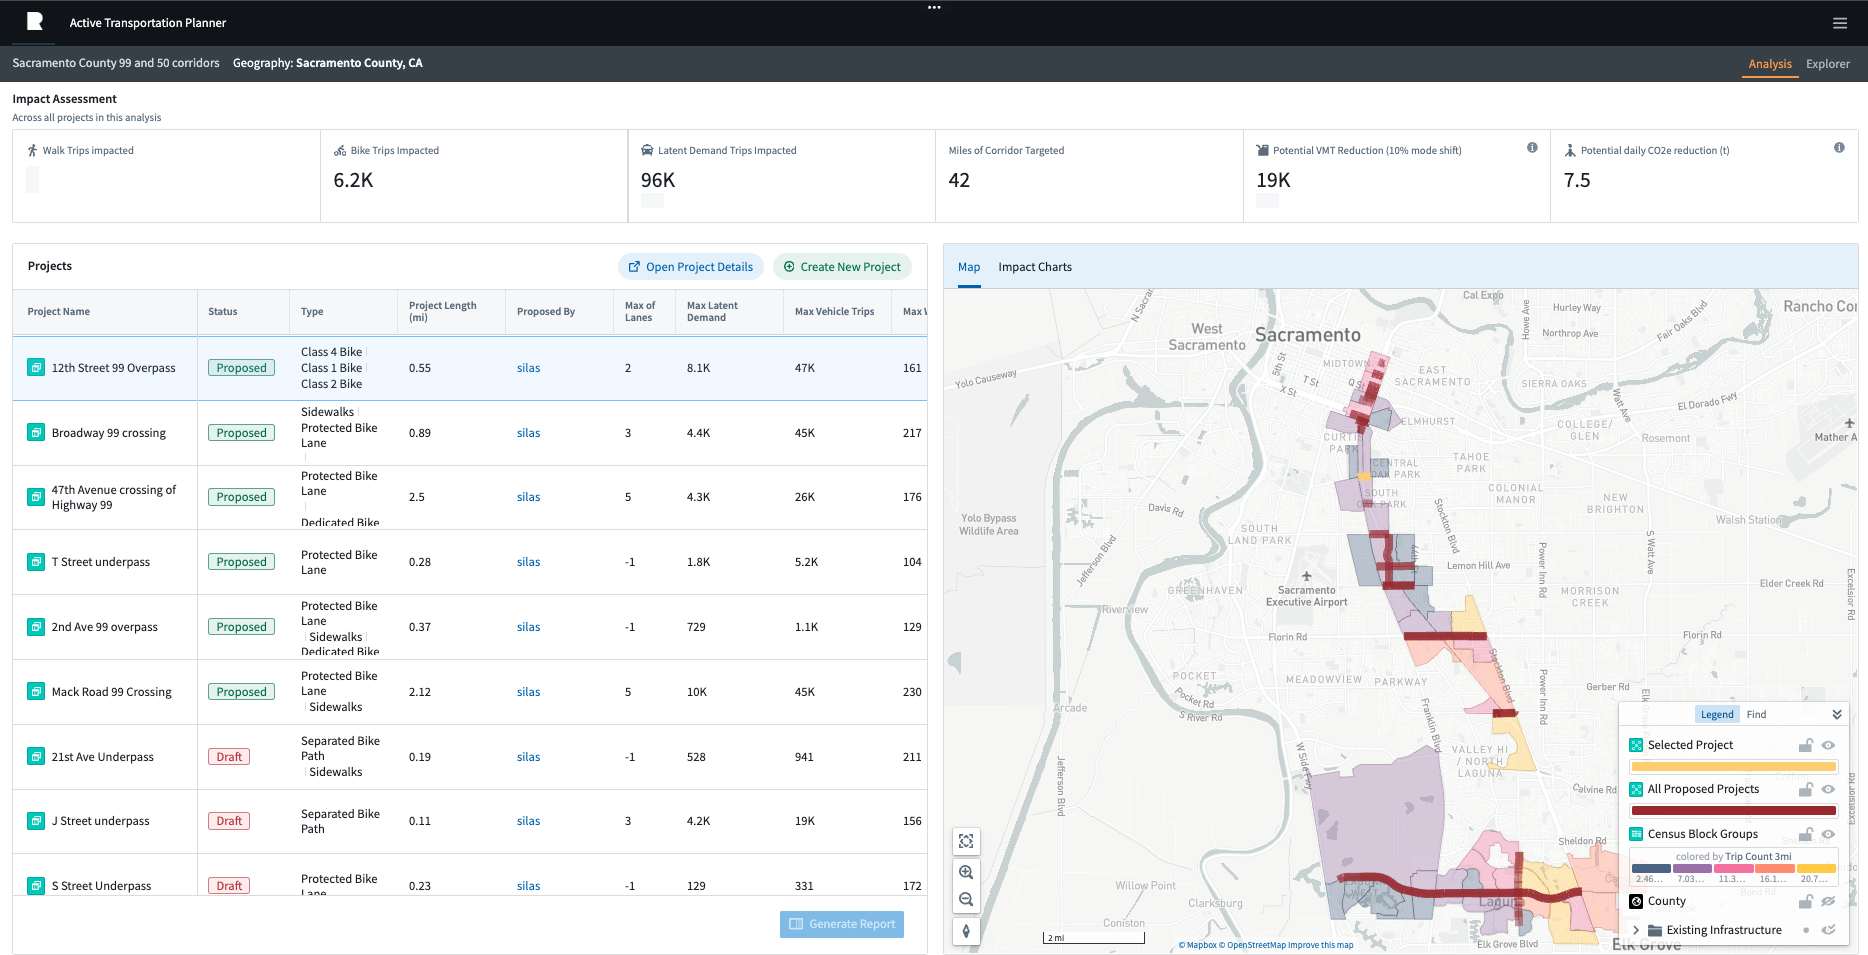
- The Analysis View gives you a high level view of the proposed projects in your analysis. From this view you can do a few things:
- View comprehensive impact metrics for your active transportation plan in the top bar. More details on how these metrics are compiled can be found in the Methodology Section
- List of projects in the analysis, containing summary information about the project.
- Map showing the proposed projects, as well as the latent demand in adjacent block groups, and existing infrastructure and POIs (e.g. educational facilities).
To view metrics on the direct and indirect, select a project from the list on the left, then click “Open Project Details”. You can edit or delete the project by right-clicking it in the table.
- You can add new projects to the analysis view by clicking “Create New Project”, which enables you to search for a street name, and select a subset of that street. You can also create projects from the “Explorer” view, which enables an open ended tool for ranking block groups and and network corridors tool based on latent demand. Open the explorer view by clicking on the explorer tab in the upper right.
- The Explorer view has two views: a “Network” view and a “Neighborhood” view.
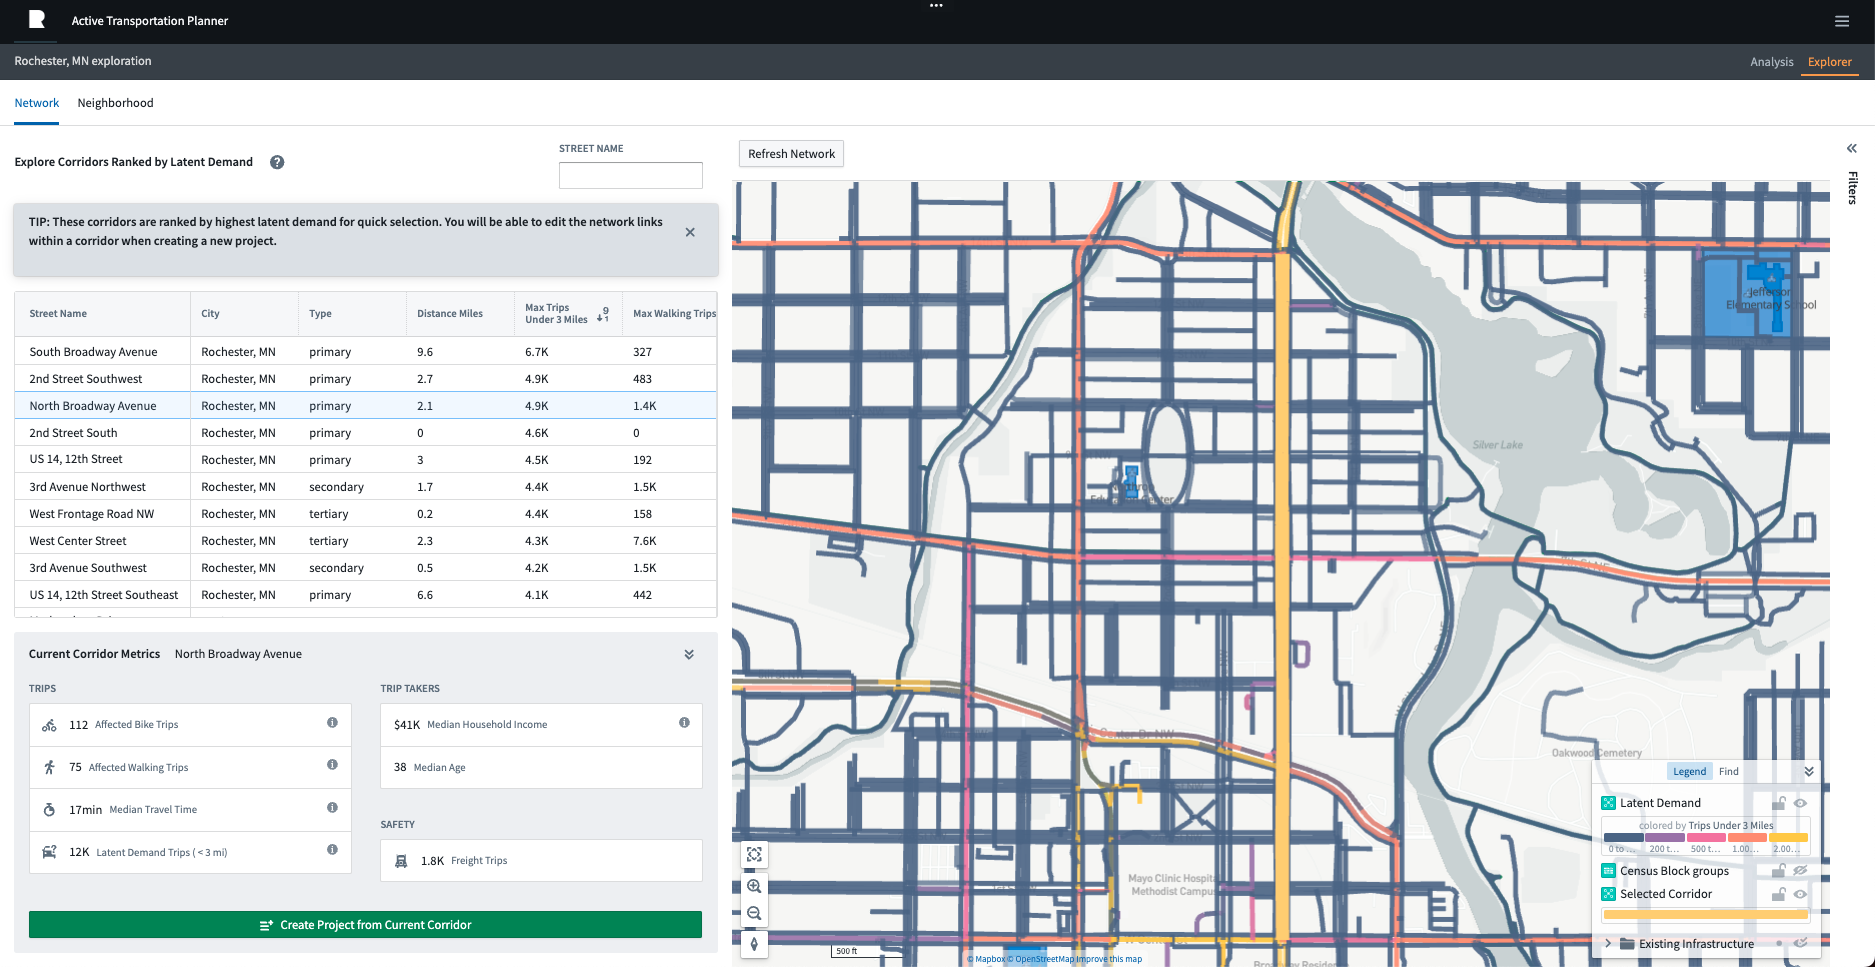
The neighborhood view displays the transportation network, colored by latent demand trip count on any given segment of the network, i.e. the daily trip volume for automobile trips under 3 mi at a particular piece of the network. At the left it has a list of corridors, which are ranked according to the maximum latent demand at any point on the corridor.
By clicking on a corridor in the table, you will zoom the map to that corridor, and update the metrics in the lower left. You can also shift + click and drag to select network links and calculate metrics. If you select a set of network links you want to turn into a project proposal, you can “Create Project from Current Corridor”. You will have an opportunity to refine your selection in the subsequent dialogue.
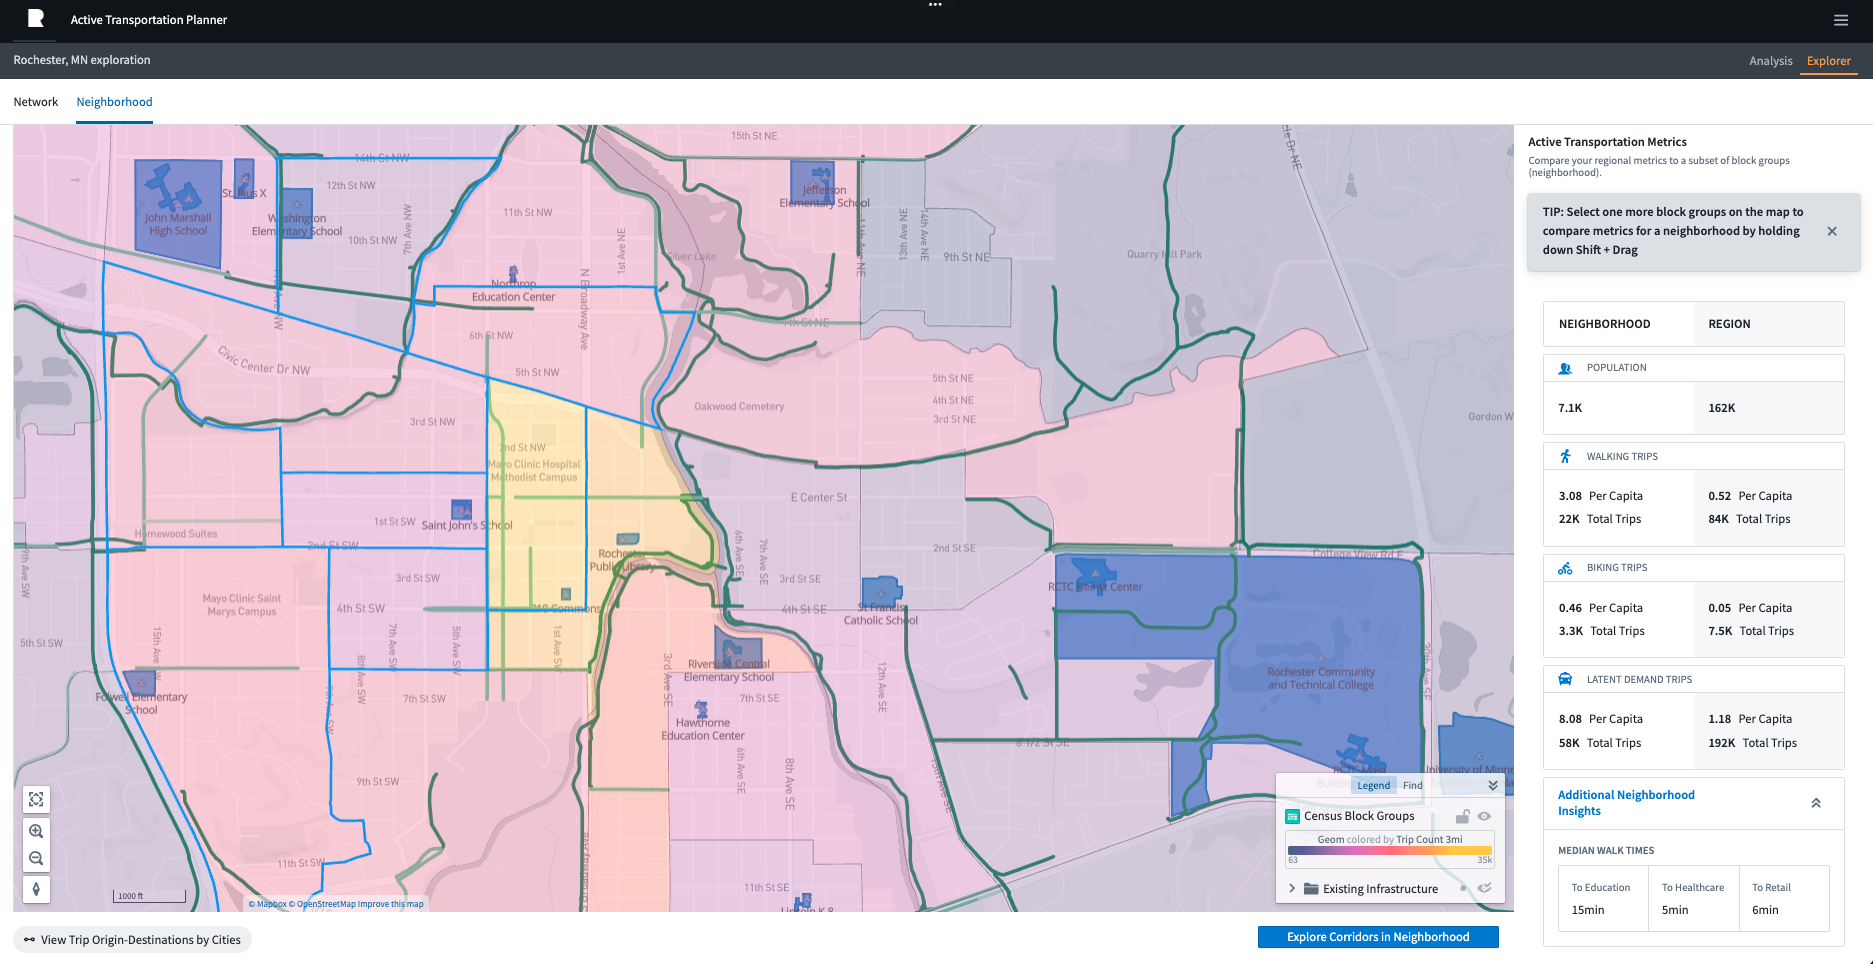
The Neighborhood view takes a higher view, and allows the identification of neighborhoods where many short automobile trips are taking place. The map displays block groups, colored by latent demand. Hold shift and click to select a set of block groups. You can see metrics update in the sidebar to reflect the neighborhood, reference against the benchmark, the county-wide selection. If you would like to drill down into an area, click “Explore Corridors In Neighborhood” to see a ranked list of corridors inside your selected block groups.
The Analysis Settings can be used to define how metrics are calculated in the application. Upon saving updates, the metrics will be automatically updated in your analysis.

Methodology and Definitions
Impacted Biking and Walking Trips
This metric appears in a few contexts in the app:
- Project Details View
- Impact Assessment
- Current Corridor Metrics
This metric uses the seasonal trips table to assess biking and walking utilization of a network link or set of network links. The metrics in the Active Transportation Planners query the number of bikers and walkers whose trips intersect at any point with the selected project’s network links.
Biking and Walking Trips Per Capita
These metrics appear on the Neighborhood sidepanel for the selected block groups, as well as the county, and appear in a number of forms:
- Total Trips: count of trips whose trip intersect with the selected census block groups at any point.
- Per Capita: normalized to the population of residents in the block group, even if the trip takers do not live in that block group are counted
Latent demand
Latent demand is meant to capture trips that are most likely to convert to biking and walking, if low-stress infrastructure is built. As a default, this will be private automobile trips of 3 miles or less, but this distance is configurable in the Analysis Settings pane.
Median Travel Time
Trip times are calculated for all trips originating in the selected block groups, and are destined for Points-of-Interest categories. More info about the categorization of those point of interests can be found in the Land Use classification.
Median Age and Household Income
These metrics are calculated for trip takers in the selected block group, even if they do not reside in the block group. More info on how demographics are modeled here: https://documentation.replicahq.com/docs/demographics-employment
Max Latent demand
For the corridor ranking, we utilize “max latent demand” for ranking them. This means the peak number of trips intersecting any segment of the corridor. The default sorting of the corridor view is based on this metric.
Indirect Effects
Indirect effects is a measurement of the trips intersecting the transportation network adjacent to the selected project. It calculates the same metrics as the directly affected metrics, but looks for any trips which intersect the surrounding network.
Existing Infrastructure
Bike Infrastructure, Educational Facility, and Transit lines are populated from publicly available data sources. If you would like Replica to add more up to date or higher fidelity versions of this data, please reach out to [email protected] for assistance.
Corridor definition
Corridors are defined as network links with matching street name, county, city, and highway classification. For example, if a street has segments on either side of a city boundary, or with different highway classifications, these will be modeled as separate corridors. Additionally, corridors are matched with sidewalk segments that are within 15 meters and have the lowest hausdorff distance to an associated road in the corridor.
Emissions (CO2e) metric
This metric is found in the
- Project Details View
- Impact Assessment
- Current Corridor Metrics
For this metric, we assume a reduction of 400 g of CO2e for every Vehicle Mile Traveled (VMT) reduction due to mode shift.
Updated 8 months ago