
Turning Movement Counts
Overview
Replica's turning movement counts (TMC) table contains information about motor vehicle turning movement counts at most signalized intersections nationwide for each day of the week, bucketed into 1-hour intervals. Data is available for Spring 2022 and Fall 2022, and is available for download in CSV format through the Replica application.
See what coverage we have in your area here by zooming in to your location of interest. This map shows coverage in the Fall 2022 season.
Sample Download
Click here to download a CSV sample of Replica's turning movement counts table.
Schema
| Field Name | Content Type | Sample Value | Description |
|---|---|---|---|
| intersection_id | String | 61.5522_-149.5329 | Unique ID of the intersection. |
| intersection_id_geom | Geography | POINT(-149.5329 61.5522) | Lat-long of the intersection in WKT POINT() format. |
| turn_maneuver | String | through | Maneuver at the intersection, such as left, right, through, u-turn. |
| movement_direction | String | S_to_W | Start to end compass direction. |
| inbound_direction | String | E | Inbound compass direction. |
| inbound_heading | Integer | 87 | Heading of the inbound road described as degrees from north (0-360). |
| turning_movement | String | NBL | Turning movement as 'NBL' or 'NBT'. |
| state | String | AK | US state abbreviation indicating location of intersection. |
| inbound_stable_edge_id | String | 10908660954266870460 | A unique identifier for the network link. |
| inbound_street_name | String | Kenai Spur Highway | The common name of the network link if available. Matches the name assigned by OpenStreetMap. |
| outbound_osm_id | String | 792610357 | A unique identifier for the OSM way or supersegment ID. Can be converted to a set of stable edge IDs. |
| outbound_street_name | String | West Dimond Boulevard | The common name of the network link if available. Matches the name assigned by OpenStreetMap. |
| hour | Integer | 12 | Hour of day that the trip started, reported in the local time zone in 24-hour time format. Values in this field range between 0 and 23. |
| day | String | MON | Day of the week |
| count | Integer | 522 | TMC counts scaled from observed numbers to match total volumes along network links. |
Quality Metrics
Benchmarking
Below we compare Replica modeled counts to available ground truth data in Roseville, CA and Raleigh, NC.
Roseville, CA - Fall 2022
We compare ground truth data for Roseville, CA for Fall 2022 to Replica outputs at 60 intersections. The ground truth data was provided to Replica by the City of Roseville, and is publicly available for download.
Roseville Ground Truth vs. Replica, average midweek daily counts per intersection for Fall 2022
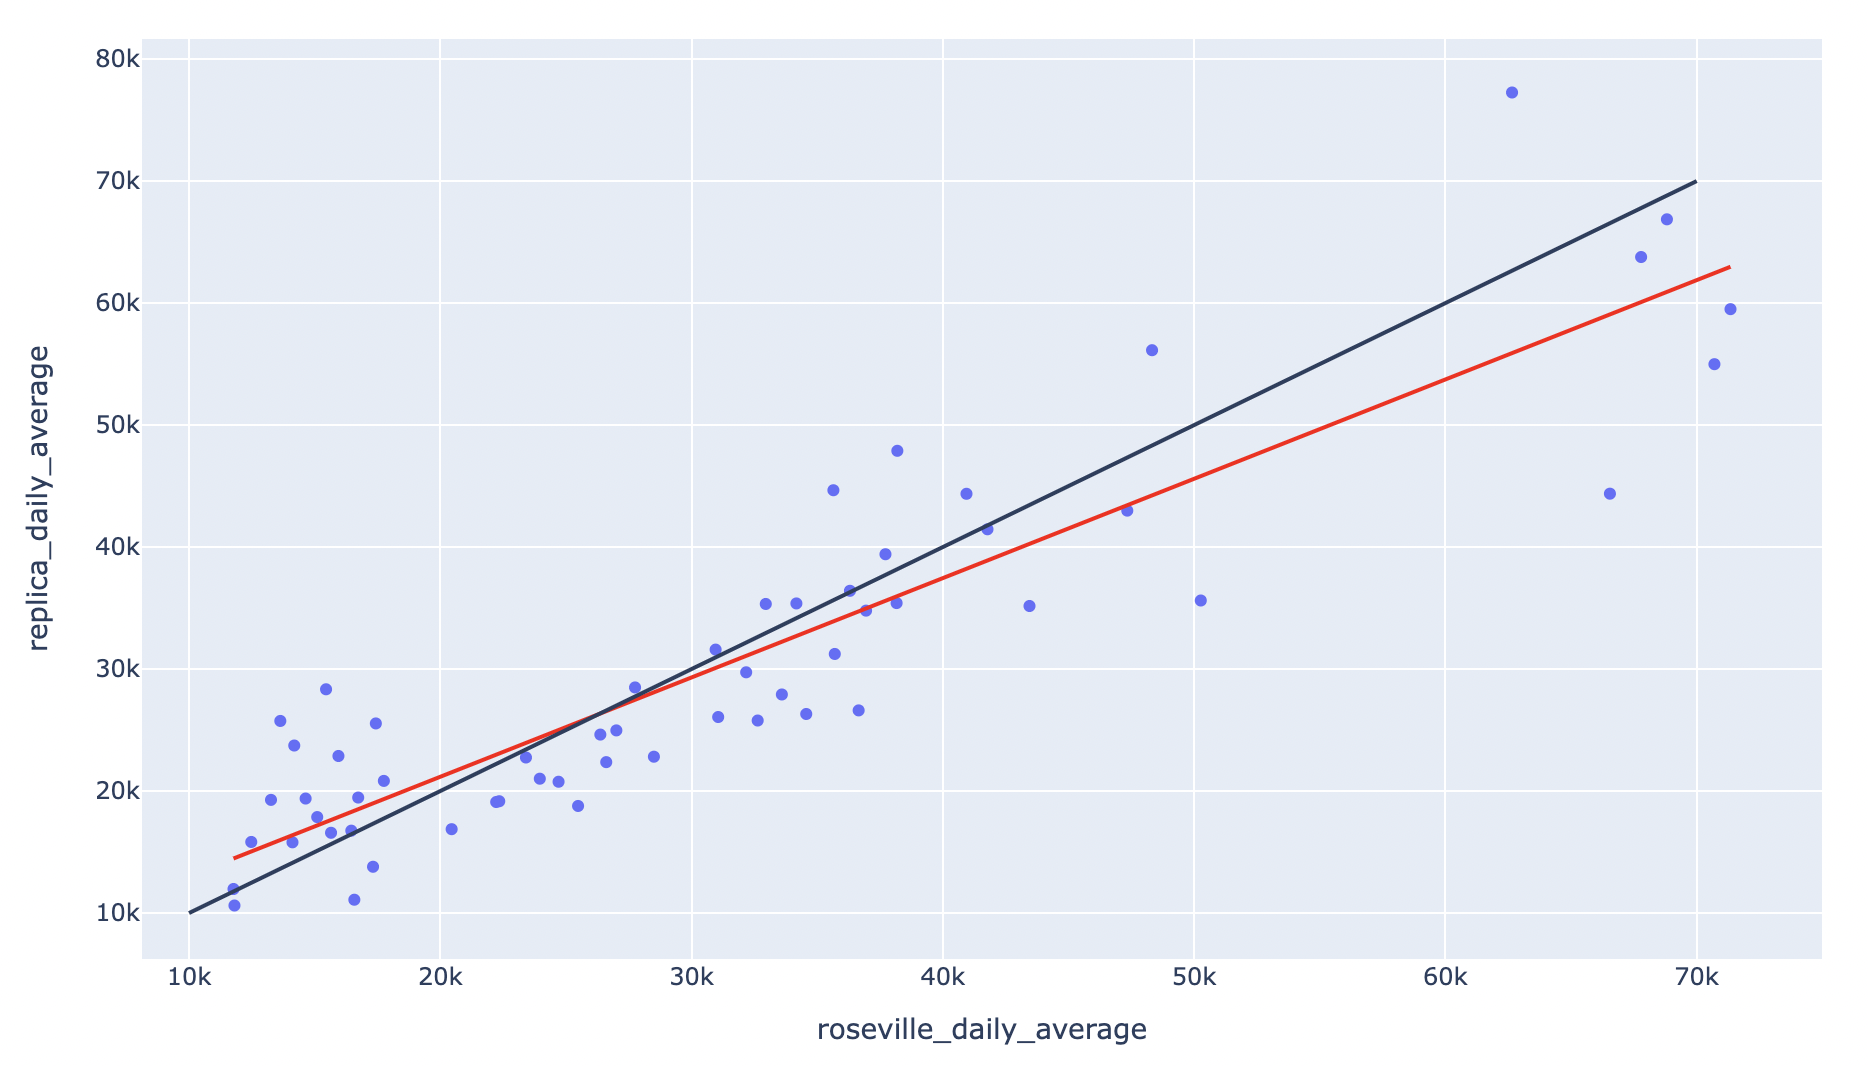
The black line is the line where y=x, while the red line is the line of best fit. The R-squared value is 0.82.
Roseville Ground Truth vs. Replica, average midweek daily counts per intersection/turning movement for Fall 2022
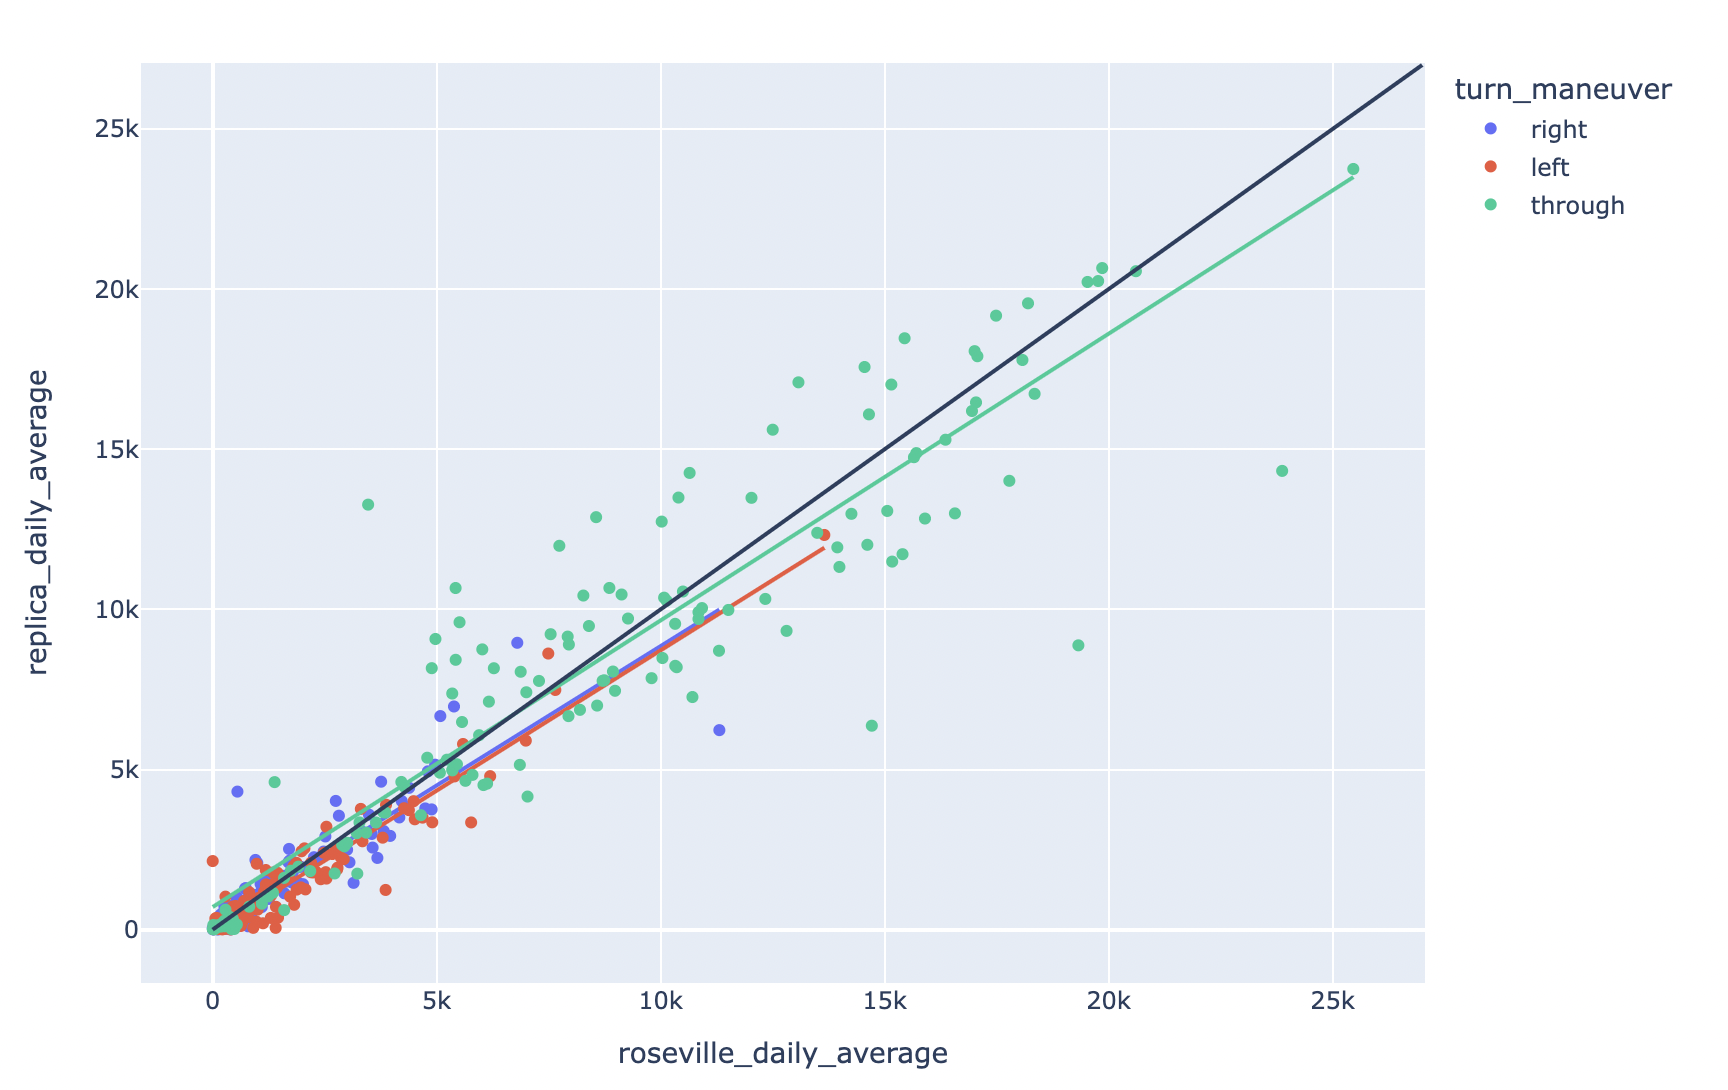
Each point in this plot represents one turning movement at an intersection - for example, SBT at a given intersection. The black line is the line where y=x, while the blue, green, and red lines are the lines of best fit for right, left, and through turn maneuvers respectively.
Roseville, CA - Spring 2022
We also compare ground truth data for Roseville, CA for Spring 2022 to Replica outputs at 66 intersections. In general, Replica TMCs for Spring 2022 are a slight overestimate of Roseville’s ground truth.
Roseville Ground Truth vs. Replica, average midweek daily counts per intersection for Spring 2022
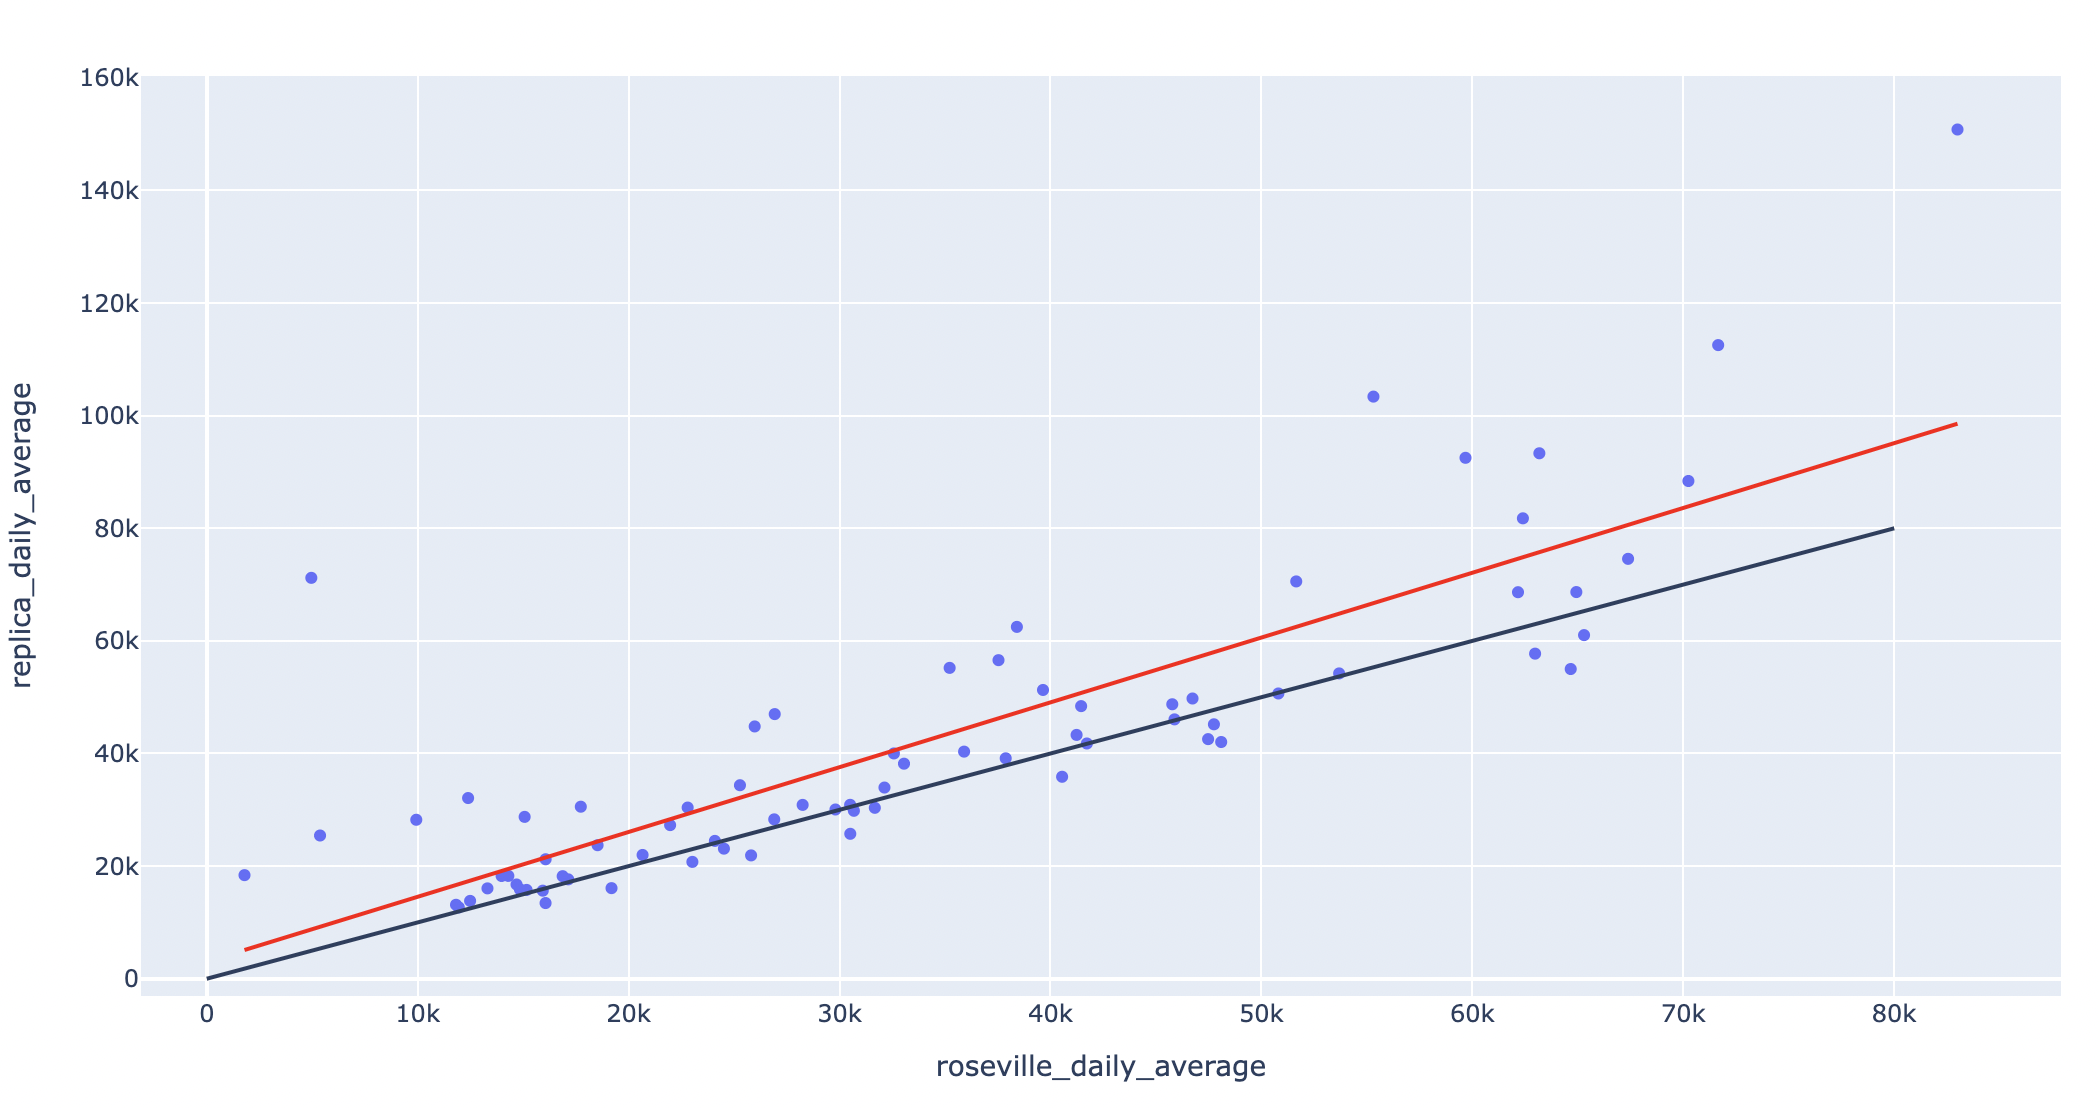
The black line is the line where y=x, while the red line is the line of best fit. The R-squared value is 0.70.
Roseville Ground Truth vs. Replica, average midweek daily counts per intersection/turning movement for Spring 2022
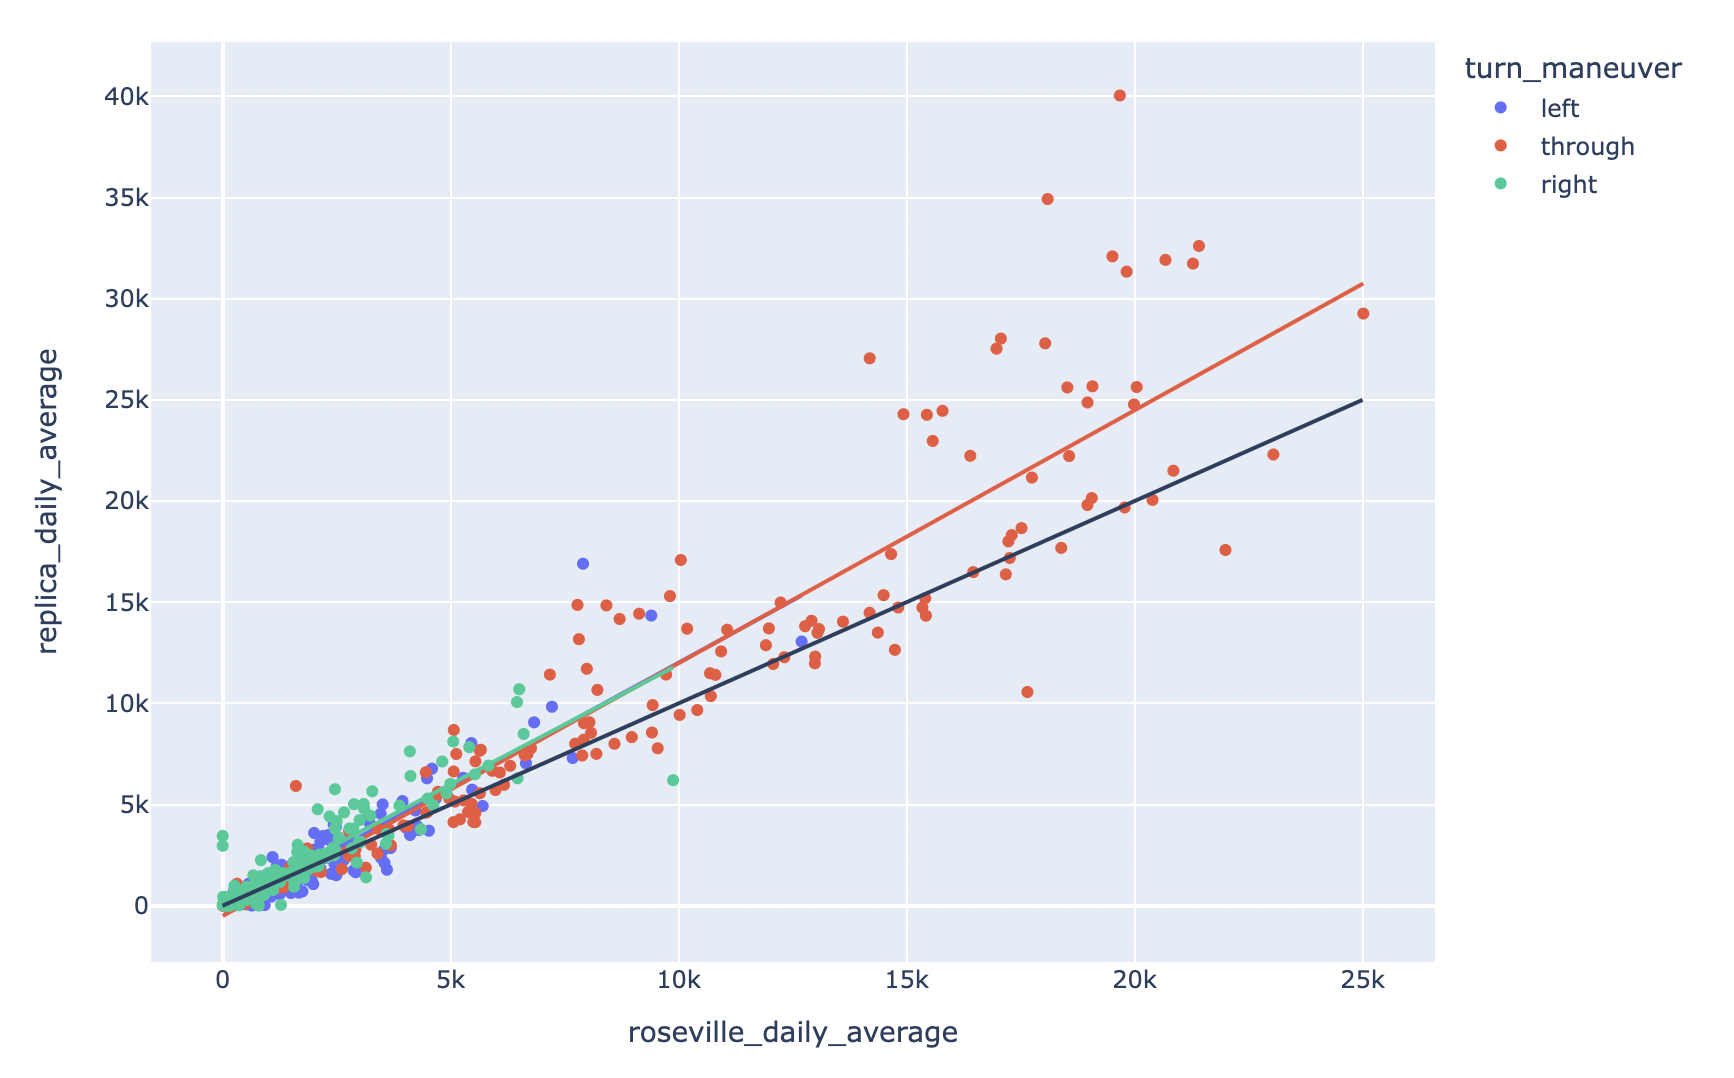
Each point in this plot represents one turning movement at an intersection - for example, SBT at a given intersection. The black line is the line where y=x, while the blue, red, and green lines are the lines of best fit for left, through, and right turn maneuvers respectively.
Raleigh, NC - Spring 2022
We compare ground truth from four intersections in Raleigh, NC, collected in January 2022, to the Spring 2022 Replica TMC dataset. The observed data was provided to Replica by Kimley-Horn, and the count was performed by Quality Counts.
The plots below show the AM Peak and PM Peak counts for each intersection/turn maneuver, with strong matches between Replica and ground truth. The Replica AM Peak counts for each intersection/turn maneuver are calculated by summing the counts for that intersection/turn maneuver in the hour buckets for 7AM and 8AM for Tuesday, Wednesday, and Thursday, and then averaging the results. The Replica PM Peak counts for each intersection/turn maneuver are calculated by summing the counts for that intersection/turn maneuver in the hour buckets for 4PM and 5PM for Tuesday, Wednesday, and Thursday, and then averaging the results.
Raleigh Ground Truth vs. Replica, AM peak counts per intersection/turn maneuver
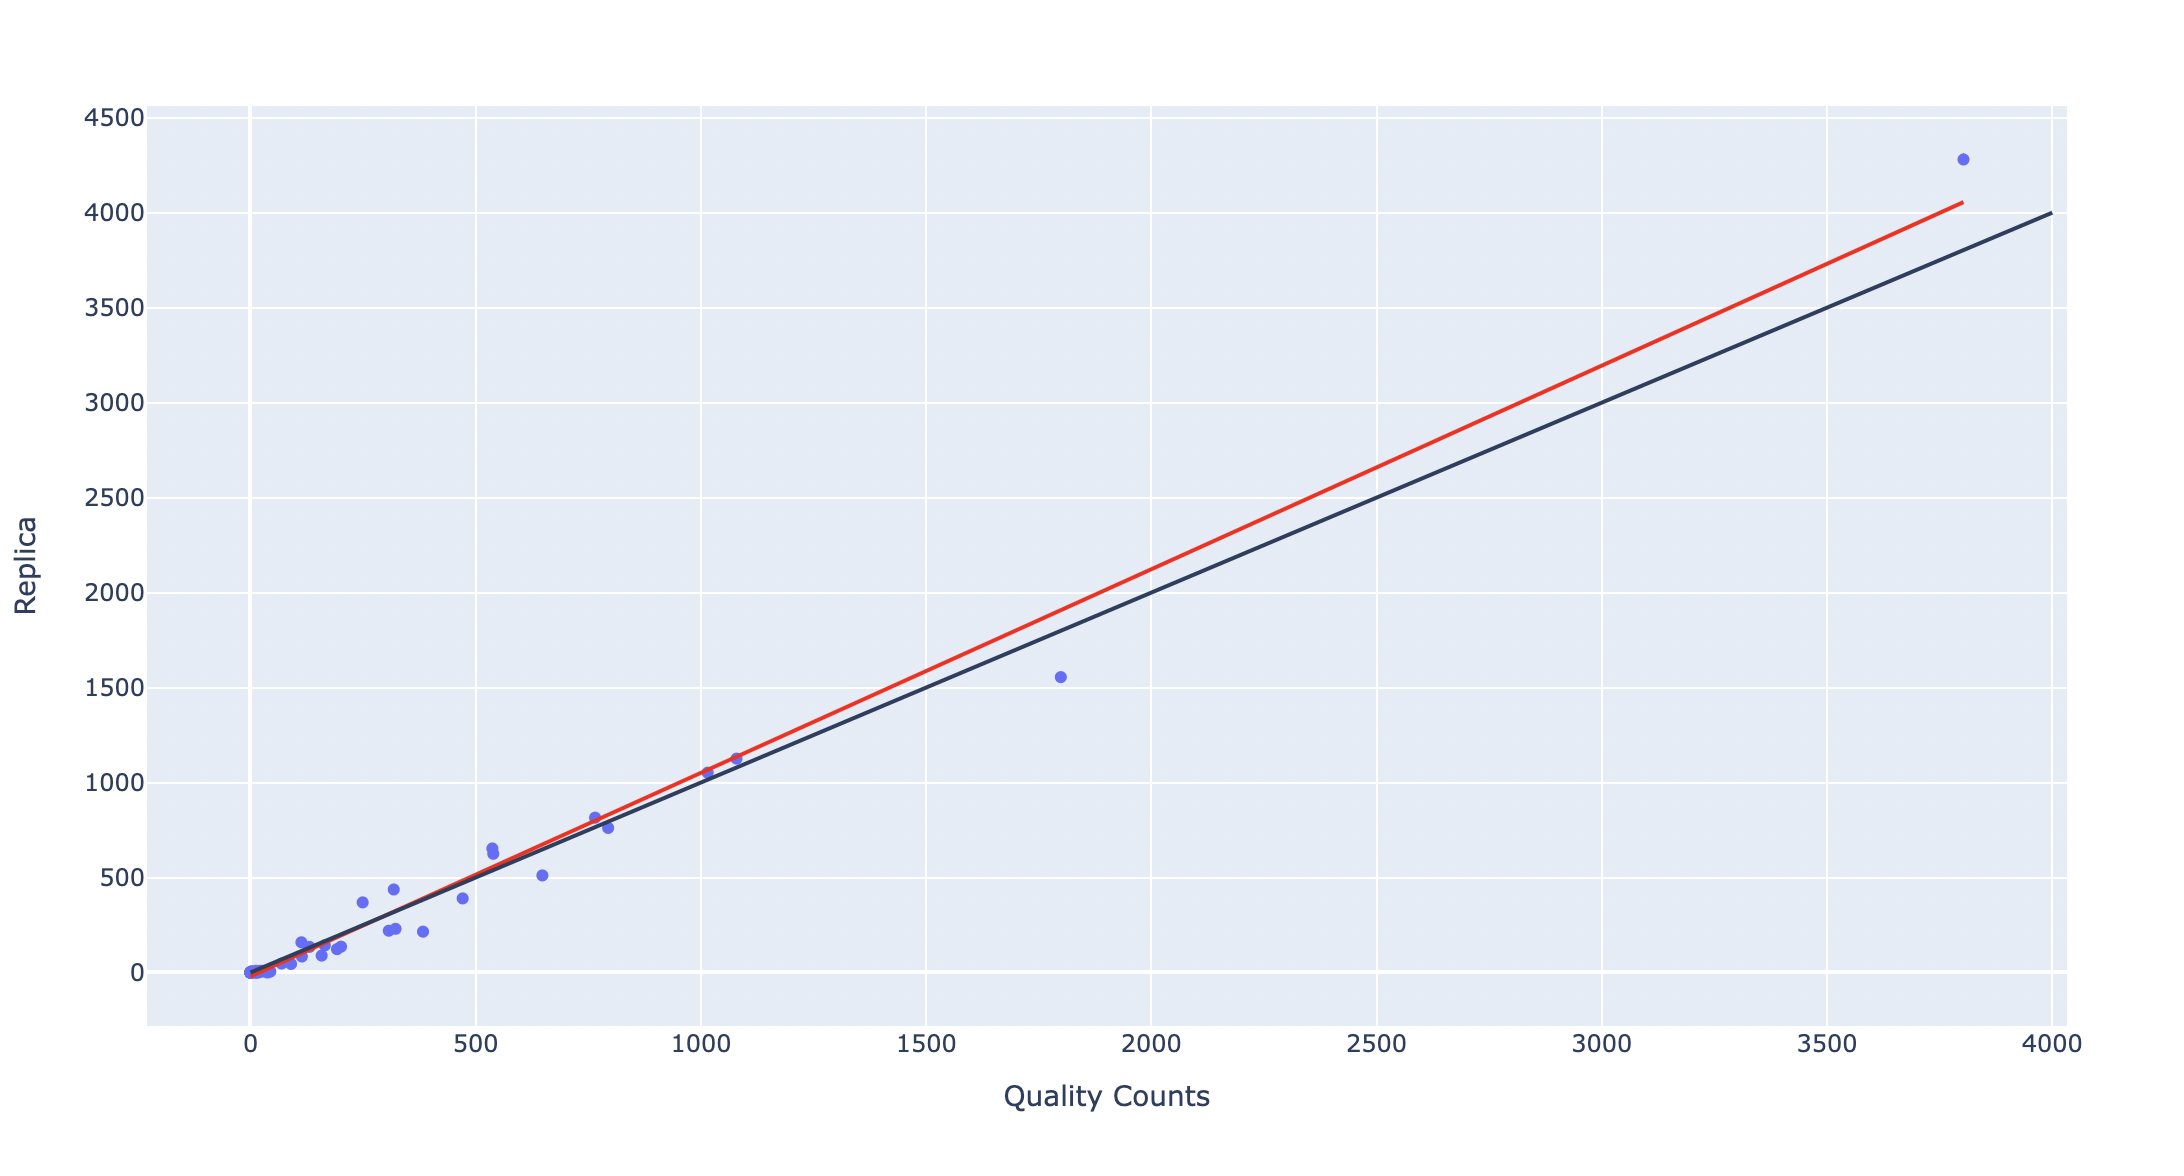
The black line is the line where y=x, while the red line is the line of best fit. The R-squared value is 0.99.
Raleigh Ground Truth vs. Replica, PM peak counts per intersection/turn maneuver
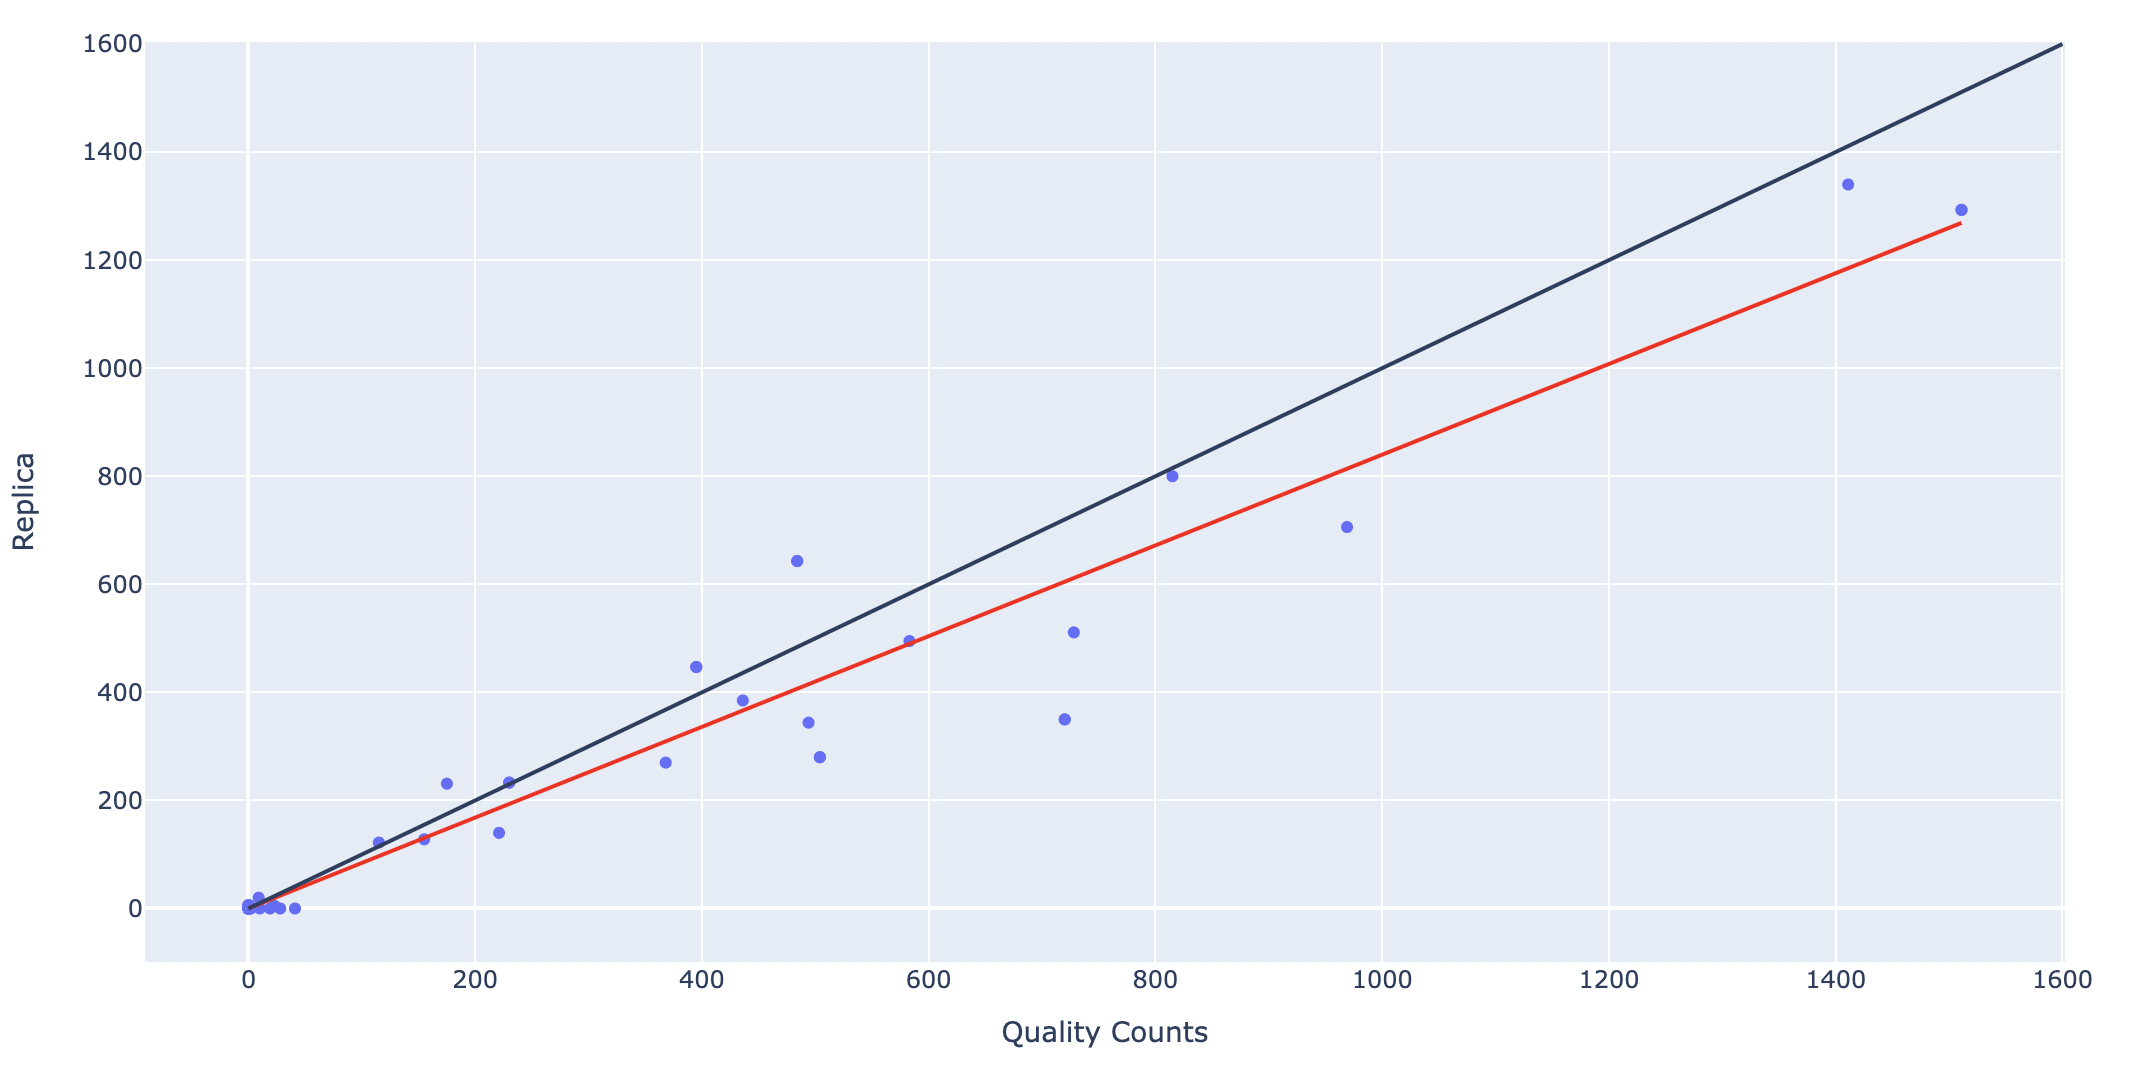
The black line is the line where y=x, while the red line is the line of best fit. The R-squared value is 0.94.
Methodology
Replica sources turning movement counts from raw data sources that are then scaled and aggregated to produce hourly counts for a “typical” week in a given season. The primary raw data source is observed counts from log reports on a time-windowed, per-intersection basis, collected across a period of two weeks. The two-week data collection window is selected to avoid major holidays and events that would disrupt traffic irregularly. Intersections with fewer than 240 average vehicle observations per day are removed due to low signal.
The cleaned counts are then scaled up to match overall network link volumes. To maintain consistency across an intersection, a single scaling factor is modeled for each intersection, accounting for all inbound and outbound network links. If a particular movement has a scaled hourly value greater than 6,000 vehicles, the intersection is removed to reduce outliers (Hawaii is an exception). Network link volumes, from which the scaling factor is derived, can vary due to variation in the ground truth sample vehicle population compared to true overall traffic volumes. In order to account for this variation, data vendors separate sample vehicle streams into functional categories, each of which has sufficient trip density to constitute an acceptable sample size on most roads. In general, the variation in network link volume penetration rate across a city is usually within ±25% of the mean.
As a result of this methodology, inaccuracies in TMC data can result from issues with the observed count or the scaling factor. Regarding the latter, the total variation in network link penetration rate across a city is typically within acceptable bounds (within 25% of the mean as discussed above), however traffic volumes themselves can vary widely – some data vendors put the figure at up to several hundred percent of the true mean. Similar statistical irregularities can arise with observed counts. As a result, it can be difficult to compensate for these irregularities with a limited window of observations. Replica is working on validations using available ground truth from across the US to improve TMC estimations.
Updated 8 months ago