
Annual Average Daily Traffic (AADT)
Overview
The annual average daily traffic (AADT) table contains information about almost all major roads. For motorways and trunks, Replica also provides single-truck volume and combination truck volume [1]. Data is available beginning in 2019 and is updated annually. The data is available for download through the Replica application in CSV, Geojson, and Shapefile formats.
To produce AADT, Replica leverages data about hundreds of millions of trips per week, in combination with network link volume ground truth. Read the full methodology here.
See what coverage we have in specific areas here. The coverage values in the table below are calculated based on the entire OSM network, which is highly detailed containing even service alleys. The denominator is all links by highway type in the OSM network.
| Highway | % AADT Coverage in 2025 Data | % Single-Unit and Combination Truck Coverage in 2025 Data |
|---|---|---|
| Motorway | 98% | 98% |
| Trunk | 98% | 97% |
| Primary | 99% | 96% |
| Secondary | 98% | |
| Tertiary | 92% | |
| Residential | 52% | |
| Other | 35% |
Sample Download
Click here to download a sample of Replica's AADT table.
Schema
| Field Name | Content Type | Sample Value | Description |
|---|---|---|---|
| stable_edge_id | String | 2171086143316490127 | The matching stable edge id (mapping to Replica's road network) for this segment. This id will match the Places season for Fall of the selected year. |
| comp_stable_edge_id | String | 13608319450172218181 | If bidirectional is True for this segment, this field provides the matching stable edge id (mapping to Replica's road network) for the opposing direction of travel. This id will match the Places season for Fall of the selected year. |
| osm_id | String | 155000229 | OSM Way ID (version 2020-07-01 for the 2019 data; version 2021-09-01 for the 2021 data; version 2022-12-01 for the 2022 data) |
| street_name | String | Isabel Avenue | The common name of the network link if available. Matches the name assigned by OpenStreetMap. |
| highway | String | trunk | The classification of the link based on OpenStreetMap data. |
| length | Float | 229.22 | The distance (length) of the network link in meters. |
| bidirectional | Boolean | TRUE | True if the provided traffic volume is the sum for both directions of an undivided roadway. False if for only one direction. |
| heading | Integer | 176 | The heading of the network link. |
| compass_direction | String | NE | The compass direction of the network link. |
| geometry | Geography | LINESTRING(-97.398509 27.662232, -97.398556 27.662034, -97.398517 27.661988) | The geometry (linestring) for each network link. |
| aadt | Integer | 494 | The annual average daily traffic volume of the network link. This value is inclusive of single-unit and combination truck volumes. |
| aadt_single_unit | Integer | 54 | The annual average daily traffic volume of single unit trucks on the network link. Populated for FRC 1 and 2 roads, null otherwise. |
| aadt_combination | Integer | 44 | The annual average daily traffic volume of combination trucks on the network link. Populated for FRC 1 and 2 roads, null otherwise. |
Methodology
There are two inputs to the Replica AADT model:
- A large panel of pre-processed vehicle counts derived from connected vehicle data. We also use trajectories from connected trucks with high-level vehicle classification - medium trucks and heavy trucks. Both panels contains information about hundreds of millions of trips per week, and constitutes more than 30% of all trips that happen.
- A set of ground truth AADT values, derived from HPMS data, conflated to the same representation of the roadway network. These AADT values are broken out by vehicle classification—total count, single-unit truck, and combination truck. We use the most up-to-date HPMS data available: 2024. [2]
We use the ground truth data to infer the “penetration rate” of the probe panel. The penetration rate is what fraction of actual trips are represented in the panel. In the initial iteration of the Replica AADT product, the penetration rate was defined as a function of the properties of the link. In this iteration, for overall AADT, the penetration rate is allowed to vary as a function of the H3 cells containing the network link and the highway type.
We use ElasticNet regression to learn spatially-varying scaling factors that convert GPS probe vehicle counts into AADT estimates. Ground truth coverage is often sparse; some geographic areas and road type combinations may have limited or no sensor data for model training. ElasticNet addresses this challenge through regularization, which enables the model to learn smooth, spatially-coherent scaling factors by leveraging patterns across similar areas and road types. The technique combines two forms of regularization: Ridge regression ensures neighboring areas have similar scaling factors (reflecting realistic geographic variation in GPS penetration rates), while LASSO regression identifies areas with insufficient training data that should fall back to broader regional averages. The model also incorporates constraints to prevent unrealistic scaling factors and uses cross-validation to optimize performance. This approach ensures comprehensive, accurate AADT predictions across the entire road network, including roads far from ground truth sensors, while maintaining spatial coherence and preventing overfitting to noisy data.
Once this is done, inference using the model is straightforward: every link with probe vehicle data gets multiplied by a coefficient based on it's h3 cell and highway type. When aggregated at the daily level and averaged, this produces a by-vehicle classification model for each network link’s AADT, nationwide. By aggregating at the hourly level instead, we can also produce an estimate for the typical volumes on a per-day of week, per-hour of day basis.
Quality Metrics
Model Validation
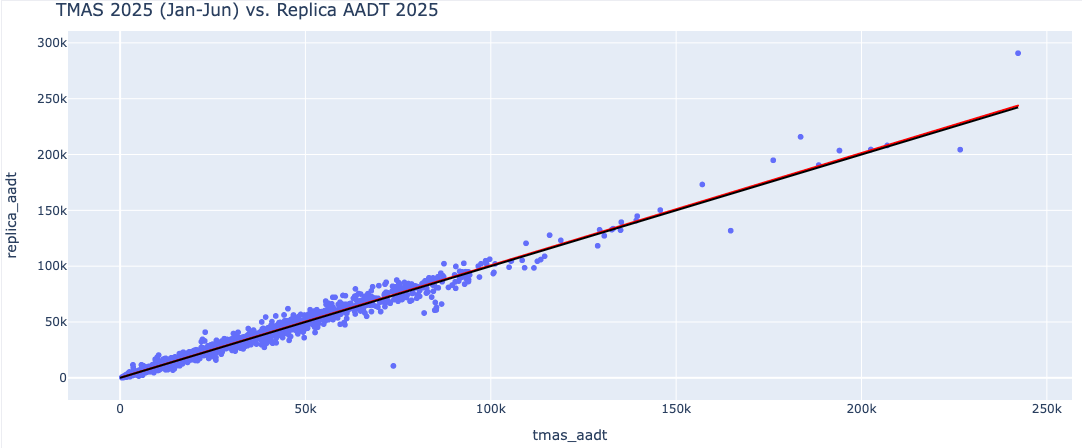
Replica’s 2025 Annual Average Daily Traffic (AADT) model was developed using 2024 HPMS data and 2025 permanent counter data from 10 select states. To ensure an unbiased assessment, this validation compares Replica’s outputs against FHWA Traffic Monitoring Analysis System (TMAS) data from January through June 2025. Notably, all data from the 10 training states were excluded from this analysis. By validating against the remaining 40 states, we ensure a "out-of-sample" test, verifying the model's accuracy on independent data.
The table below summarizes the distribution of Replica’s AADT estimates within specific percentage error margins relative to permanent counter volumes. Additionally, the scatter plot illustrates the correlation (R-squared= 0.98) between FHWA TMAS AADT (January–June 2025) and Replica AADT (2025), demonstrating the model's overall fit and reliability.
| Error Bucket | Percent of Counters | Cumulative Percent |
|---|---|---|
| Within 5% | 45.3% | 45% |
| Within 10% | 27.5% | 73% |
| Within 20% | 18.2% | 91% |
| Within 30% | 5.1% | 96% |
| Within 50% | 2.7% | 99% |
| Within 100% | 1.0% | 100% |
| Over 100% | 0.1% | 100% |
Appendix
[1] Functional Road Classes describe how major a road is. FRC 1: Highways and major interstates. FRC 2: Major artery. FRC 3: Major road. FRC 4 and higher: Neighborhood Streets. Single-Unit Trucks are defined as FHWA Vehicle Classes 5-7. Combination Trucks are defined as FWHA Vehicle Class 8 or greater.
[2] States for which we only have 2019 HPMS ground truth data: Washington, Oregon, Idaho, Nevada, Utah, Arizona, New Mexico, South Dakota, Wisconsin, Mississippi, Tennessee, South Carolina, West Virginia, Virginia, Pennsylvania, Vermont, Rhode Island, Maine, Alaska. For all other states, there is HPMS ground truth data for both 2019 and 2021.
[3] A strongly regularized formulation would be more likely to give equal scaling factors to the two trips mentioned, whereas a more weakly regularized formulation would attempt to satisfy the ground truth constraint however possible. In such massively underdetermined systems like these, totally un-regularized least squares will match the training data exactly and is less likely to generalize.
Updated 3 months ago