
Safe Streets Planner
Overview
Safe Streets Planner helps agencies proactively identify and prioritize their highest-risk corridors. It combines three complementary signals of roadway risk; observed driver events (e.g., sudden braking, phone handling, speeding), historical crash records, and Replica's multimodal trip activity, into a single, customizable Risk Score for every corridor in a selected city or county.
With the Safe Streets Planner, users can:
- Customize risk parameters. Choose the time period, travel modes, driver event types, crash attributes, and demographic segments that matter for a given analysis.
- Weight what matters. Control how much crashes, driver events, and exposure (trip activity) each contribute to the Risk Score.
- Rank corridors by risk. View a ranked list and map of corridors, scored 0–100 relative to all other corridors in the analysis area.
- Drill into a corridor. Inspect a corridor's score breakdown, its underlying driver event, trip, and crash statistics, and see which segments within the corridor have the highest relative risk.
Because the Risk Score blends leading indicators (driving behavior events) with lagging indicators (crashes) and normalizes both against travel activity, agencies can identify emerging problem locations before they appear in crash statistics, a core principle of the Safe System approach.
Safe Streets Planner in Action
Explore view
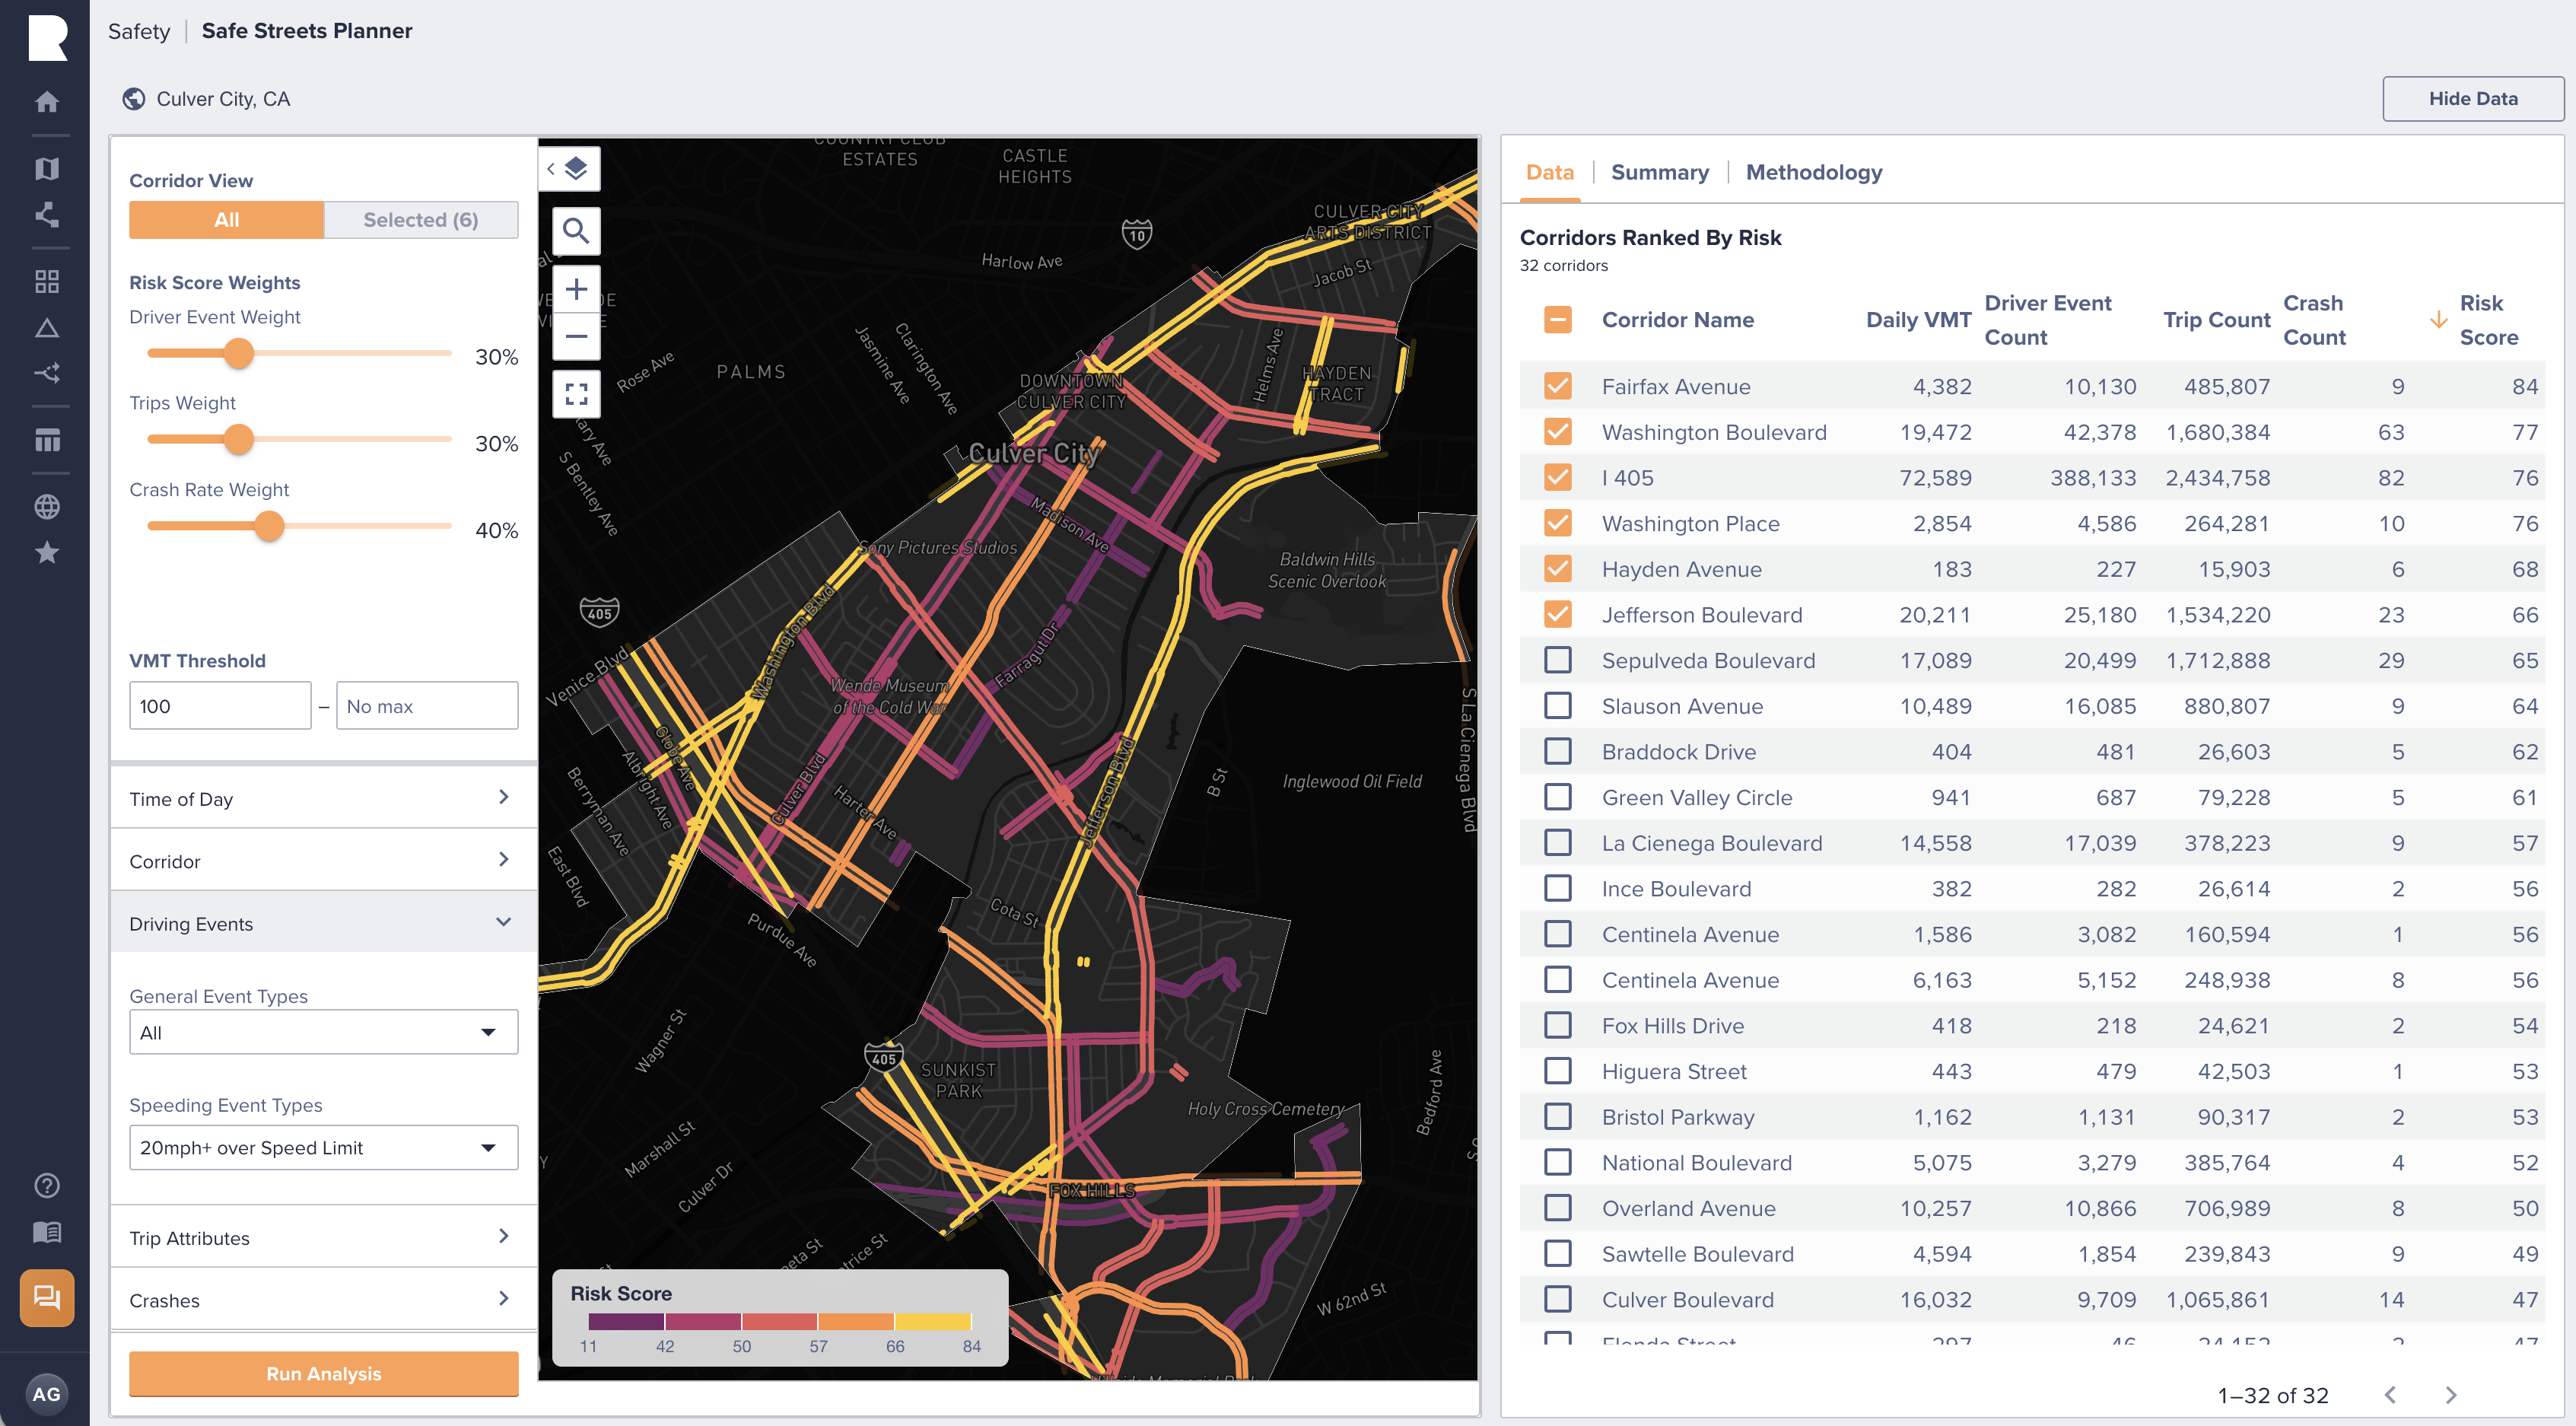
The default view shows every qualifying corridor in the selected geography, ranked by Risk Score in a sortable data table and symbolized on the map. Map controls let users set the analysis filters (time of day, corridor type, VMT threshold, driving behavior event types, trip attributes, and crash attributes) and adjust the Risk Score weights. Filter changes are applied by pressing Run Analysis. Weights can be adjusted for each of crash rate, trips, and driver events to compute a composite risk score, fitted to a 0 to 100 percentile rank, with 100 representing the highest confluence of the weighted data inputs.
Corridor detail view
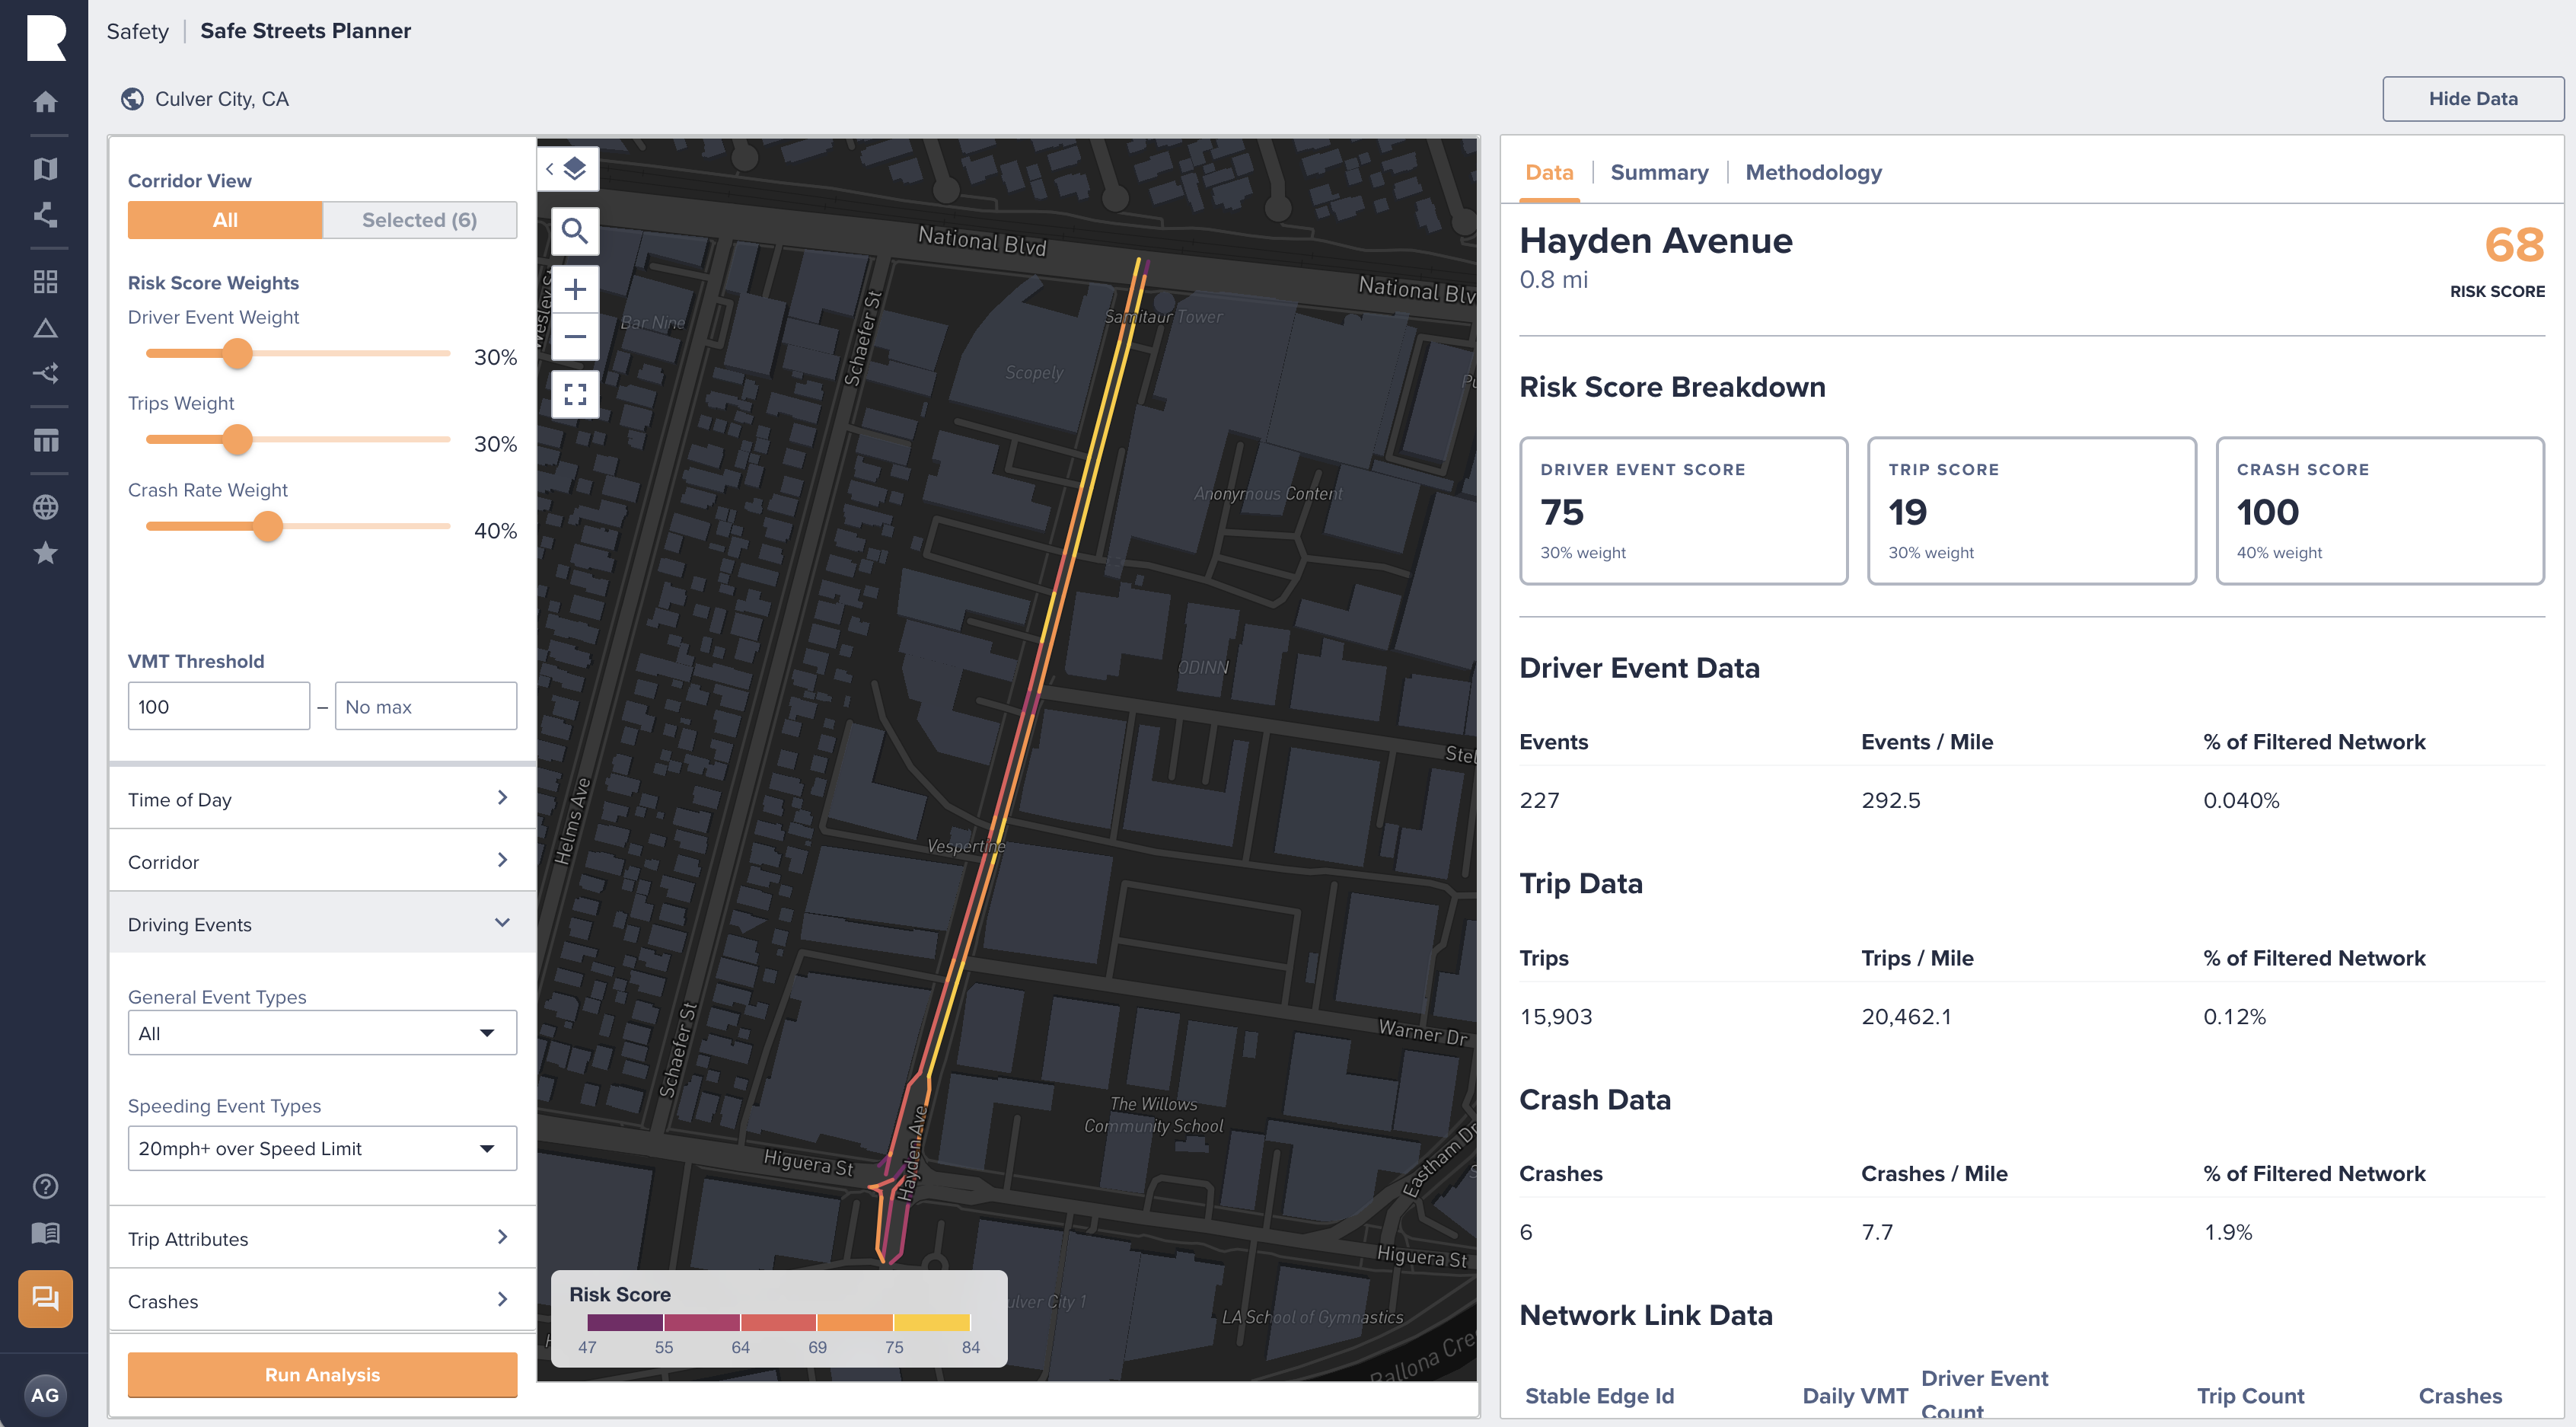
Selecting a corridor opens a detail view with:
- Risk Score Breakdown. The corridor's Driver Event Score, Trip Score, and Crash Score, alongside the weight each contributes to the overall Risk Score.
- Driver Event, Trip, and Crash data. Totals, per-mile rates, and the corridor's share of the filtered network for each measure.
- Segment-level scores. The corridor's individual network links are re-scored relative to one another, so users can pinpoint which stretch of the corridor drives its risk.
Selected view
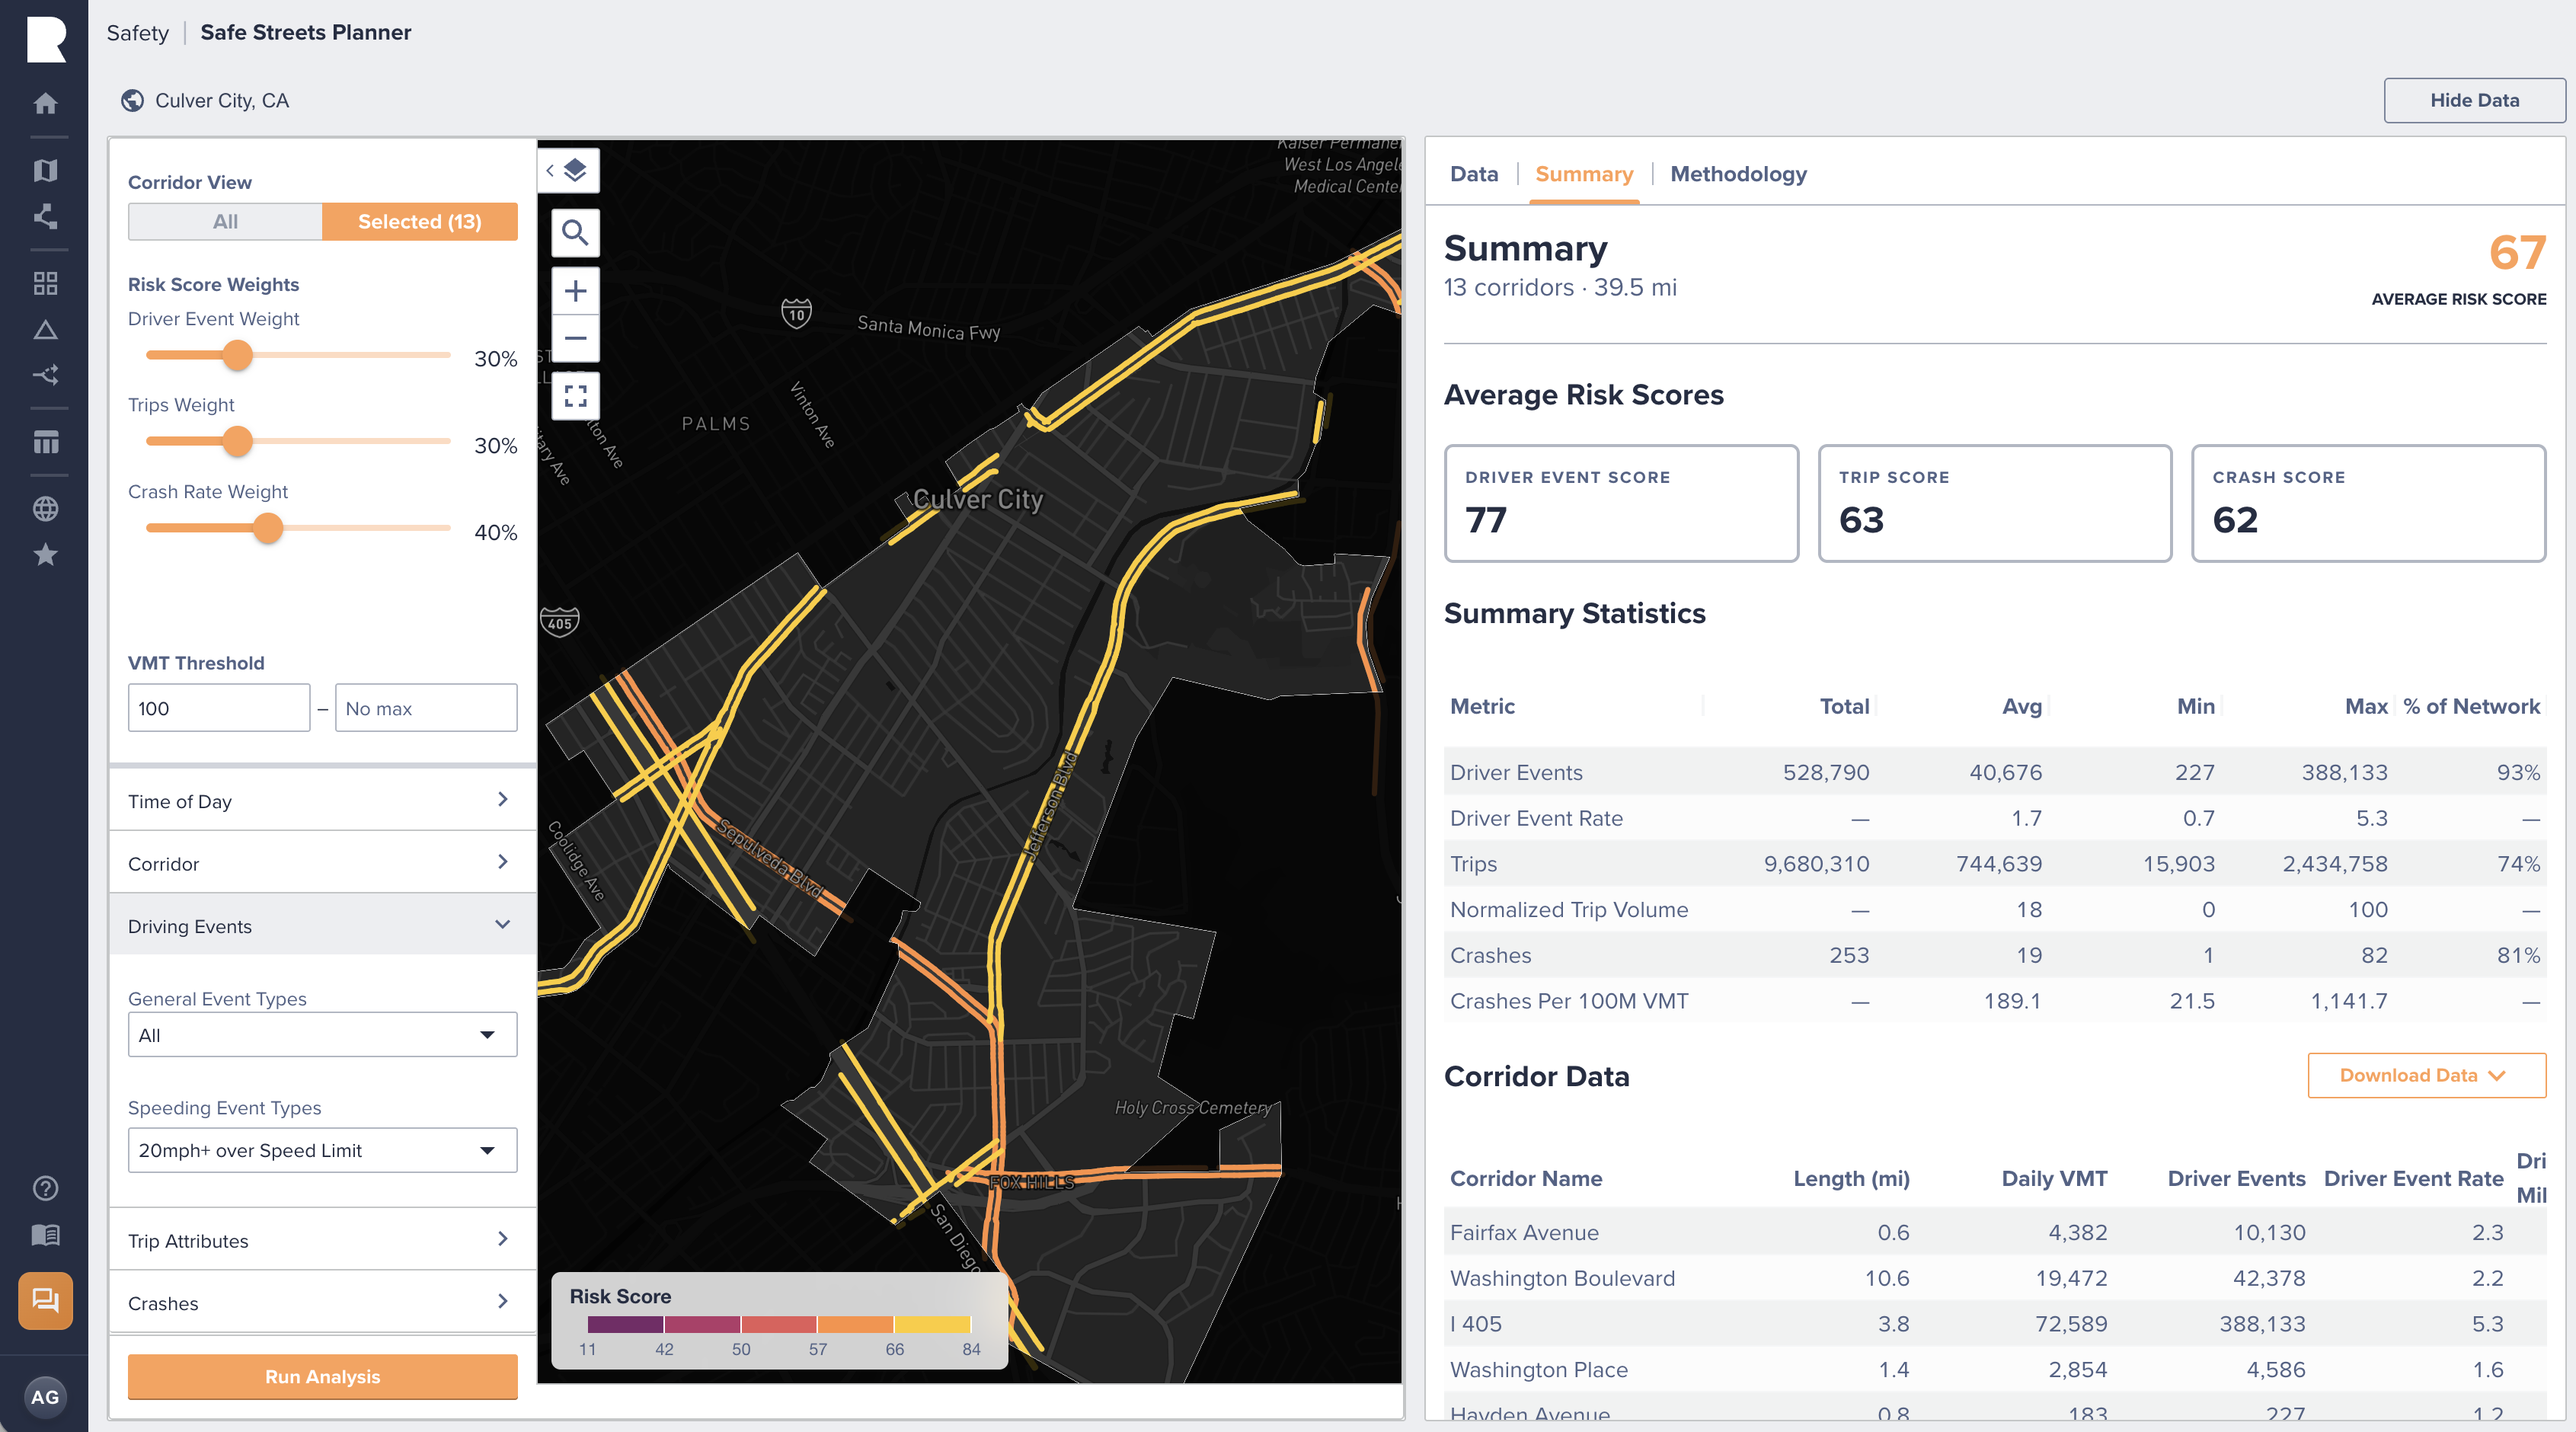
Users can multi-select corridors to build a working set; for example, a candidate High Injury Network, and view summary statistics (average scores, totals, minimums/maximums, and share of network) across the selection.
Methodology
What is a corridor?
The road network is drawn from Replica's modeled network (based on OpenStreetMap). Contiguous network links that share a normalized corridor name are grouped into a corridor. The corridor name is deliberately simplified from the raw OSM street name so that segments of the same roadway group together:
- Interstates are named by their route designation (e.g., "I 405") rather than by local segment names, so an interstate forms a single continuous corridor even where the underlying OSM names change along the route (e.g., "San Diego Freeway"). Route designations are used only for interstates, smaller streets that happen to carry a highway route designation are not absorbed into large highway corridors.
- All other streets are named with a simplified version of the OSM street name (normalizing variants such as directional prefixes), so segments of the same street group into one corridor. Where a simplified name is unavailable, the raw OSM name is used; links with no name at all are excluded.
The original OSM street name is preserved on every segment and displayed alongside the corridor name in the application (for example, when hovering a segment on the map), so users always see both the corridor's grouping name and the local street name. Streets with the same name in disconnected parts of a geography (e.g., two unrelated "1st Avenue" segments) are treated as separate corridors, so their statistics are never merged.
To prevent low-travel outliers from distorting rankings, corridors must also meet a minimum travel threshold: by default, corridors with less than 100 daily vehicle miles traveled (VMT) are excluded. This threshold is user-adjustable.
Component metrics
For each qualifying corridor, three metrics are computed from its member links, using only the trips, events, and crashes that match the user's filters:
-
Driver Event Rate. Total filtered driver events on the corridor divided by the corridor's total daily VMT:
Driver Event Rate = Σ driver events ÷ Σ daily VMT -
Trip Volume. The length-weighted average daily trip count across the corridor's links (so a short busy block doesn't dominate a long corridor, and vice versa):
Trip Volume = Σ (link trips × link miles) ÷ Σ link miles -
Crash Rate per 100 Million VMT. Following the standard FHWA crash rate methodology, total filtered crashes divided by total VMT over the analysis period, scaled to 100 million VMT:
Crash Rate = (Σ crashes ÷ Σ daily VMT) × 100,000,000 ÷ (annual day count × number of crash years)Because both crashes and daily VMT respect the weekday/weekend filter, the annualization uses 261 days for an average weekday analysis and 104 days for an average weekend analysis, multiplied by the number of years in the selected crash date range.
Percentile ranking
Each of the three metrics is converted to a percentile rank (1–100) relative to all qualifying corridors in the analysis area. A Driver Event Score of 95, for example, means the corridor's driver event rate is higher than 95% of corridors in the geography. Percentile ranking makes the three components directly comparable even though they are measured in different units.
Risk Score
The Risk Score is the weighted sum of the three percentile ranks:
Risk Score = (w_events × Driver Event Score) + (w_trips × Trip Score) + (w_crashes × Crash Score)
- Weights are set with sliders in 5% increments and must total 100%.
- Default weights where crash data is available: 40% Crash Score, 30% Driver Event Score, 30% Trip Score.
- Default weights where crash data is not available: 50% Driver Event Score, 50% Trip Score (crash data is omitted).
Because every component is a percentile rank, the Risk Score itself ranges from 0–100 and expresses risk relative to the other corridors in the analysis, under the chosen filters and weights.
Segment-level scoring
Within a corridor's detail view, the same methodology is reapplied to the corridor's individual network links: each link's driver event rate, trip count, and crash rate are percentile-ranked against the other links in that corridor and combined with the same weights. This highlights which segments of a high-risk corridor contribute most to its score.
Driver Event Data
Driver event data is sourced from de-identified and aggregated sensor-based measurements collected from mobile phones via a panel of applications. Events are captured with time, location, and speed context, map-matched to the road network, and differentiated by average weekday versus average weekend day.
Available event types:
| Category | Event types |
|---|---|
| General events | Sudden Acceleration, Sudden Braking, Phone Handling |
| Speeding events | Excessive Speeding (80+ mph), 20+ mph over the speed limit, 10–20 mph over the speed limit |
Users may include all speeding events (default), a single speeding tier, or exclude speeding entirely, alongside any combination of general event types. See Driving Behavior Data Methodology for full details.
Crash Data
Where available, the Safe Streets Planner incorporates official state crash records covering all crash severities, typically spanning 5–10 recent years depending on the state. Crashes can be filtered by:
- Date range. Bounded by the state's available crash years.
- Severity. Fatal, Injury, Property Damage Only.
- Mode involved. Pedestrian, Cyclist, Motorcycle, Motor Vehicle.
In geographies where a comprehensive state crash source is not yet integrated, the crash component is disabled and the Risk Score is computed from driver events and trip activity alone (50/50 default weights). Agencies can contact [email protected] to have their crash data added. See Crash Data Methodology for full details.
Mobility and Demographic Data
Trip activity and traveler demographics come from Replica's Places dataset, a seasonal mobility model of the full population's travel. Replica constructs a synthetic population that is statistically representative of the real population, models each person's travel behavior, simulates a typical weekday and weekend day, and calibrates outputs against observed ground-truth data. Every trip carries the demographic attributes of its (synthetic) traveler, which enables the Safe Streets Planner's equity-focused filters.
Trip activity can be filtered by:
- Trip mode. Pedestrians, Bicyclists, Motor Vehicle Occupants, Public Transit, Commercial, Taxi/TNC.
- Trip taker age. Under 5, 5–11, 12–17, 18–34, 35–49, 50–64, 65+.
- Household income and Race/Ethnicity of the trip taker.
This makes it possible to focus an analysis on vulnerable road users, for example, ranking corridors by risk to school-age pedestrians during the morning peak. See Seasonal Mobility Model Methodology for full details.
Risk Score Filters
| Filter | Description | Values |
|---|---|---|
| Time / Day | Day-of-week context and time-of-day window applied to trips and driver events (and, for day context, crashes) | Average Weekday or Average Weekend; start/end hours (default 7 AM–10 AM) |
| Corridor Type | Roadway classes included in the analysis | Motorways & trunks (and links), Primary (and links), Secondary (and links), Tertiary, Residential & living streets, Other |
| Corridor Length | Minimum and maximum corridor length | Default 0.5–75 miles |
| Daily VMT Threshold | Minimum (and optional maximum) daily VMT for a corridor to be ranked | Default minimum: 100 daily VMT |
| Driving Events | Driver event types counted toward the Driver Event Rate | Sudden Acceleration, Sudden Braking, Phone Handling; speeding tiers (All, Excessive 80+, 20+ over, 10–20 over, or exclude) |
| Trip Attributes | Trips counted toward Trip Volume | Mode, trip taker age, household income, race/ethnicity |
| Crashes | Crash records counted toward the Crash Rate | Year range, severity (Fatal / Injury / PDO), mode involved (Pedestrian / Cyclist / Motorcycle / Motor Vehicle) |
| Risk Score Weights | Contribution of each component score to the Risk Score | 0–100% each in 5% steps; must sum to 100%. Defaults: 40/30/30 (crash/event/trip) with crash data, 50/50 without |
Updated about 1 month ago