
Safety Hub
Overview
The Safety Hub is the integrated entry point for Replica's safety analysis applications. It surfaces a top-line snapshot of safety conditions in any selected geography (Baseline) and organizes Replica's safety applications by analytical purpose (Workspace). The Hub is designed so users can move quickly from "how are we doing on recent safety metrics?" to "which corridors should we act on?" to "what intervention worked?" in one workspace.
Key Features:
- Top-line snapshot of recent safety metrics for any U.S. state, county, or city
- Peer comparisons against like geographies for every top-line metric
- Ranked list of the riskiest 10 corridors per metric (counties and cities)
- One-click navigation from Baseline insights into deeper Explore and Prioritize applications
- Workspace tab organizing all safety applications by lane (Explore, Prioritize, Report, Track)
- Pre-built workflows that chain applications together for common safety planning tasks
Safety Hub in Action
The Hub is organized into two tabs:
Baseline
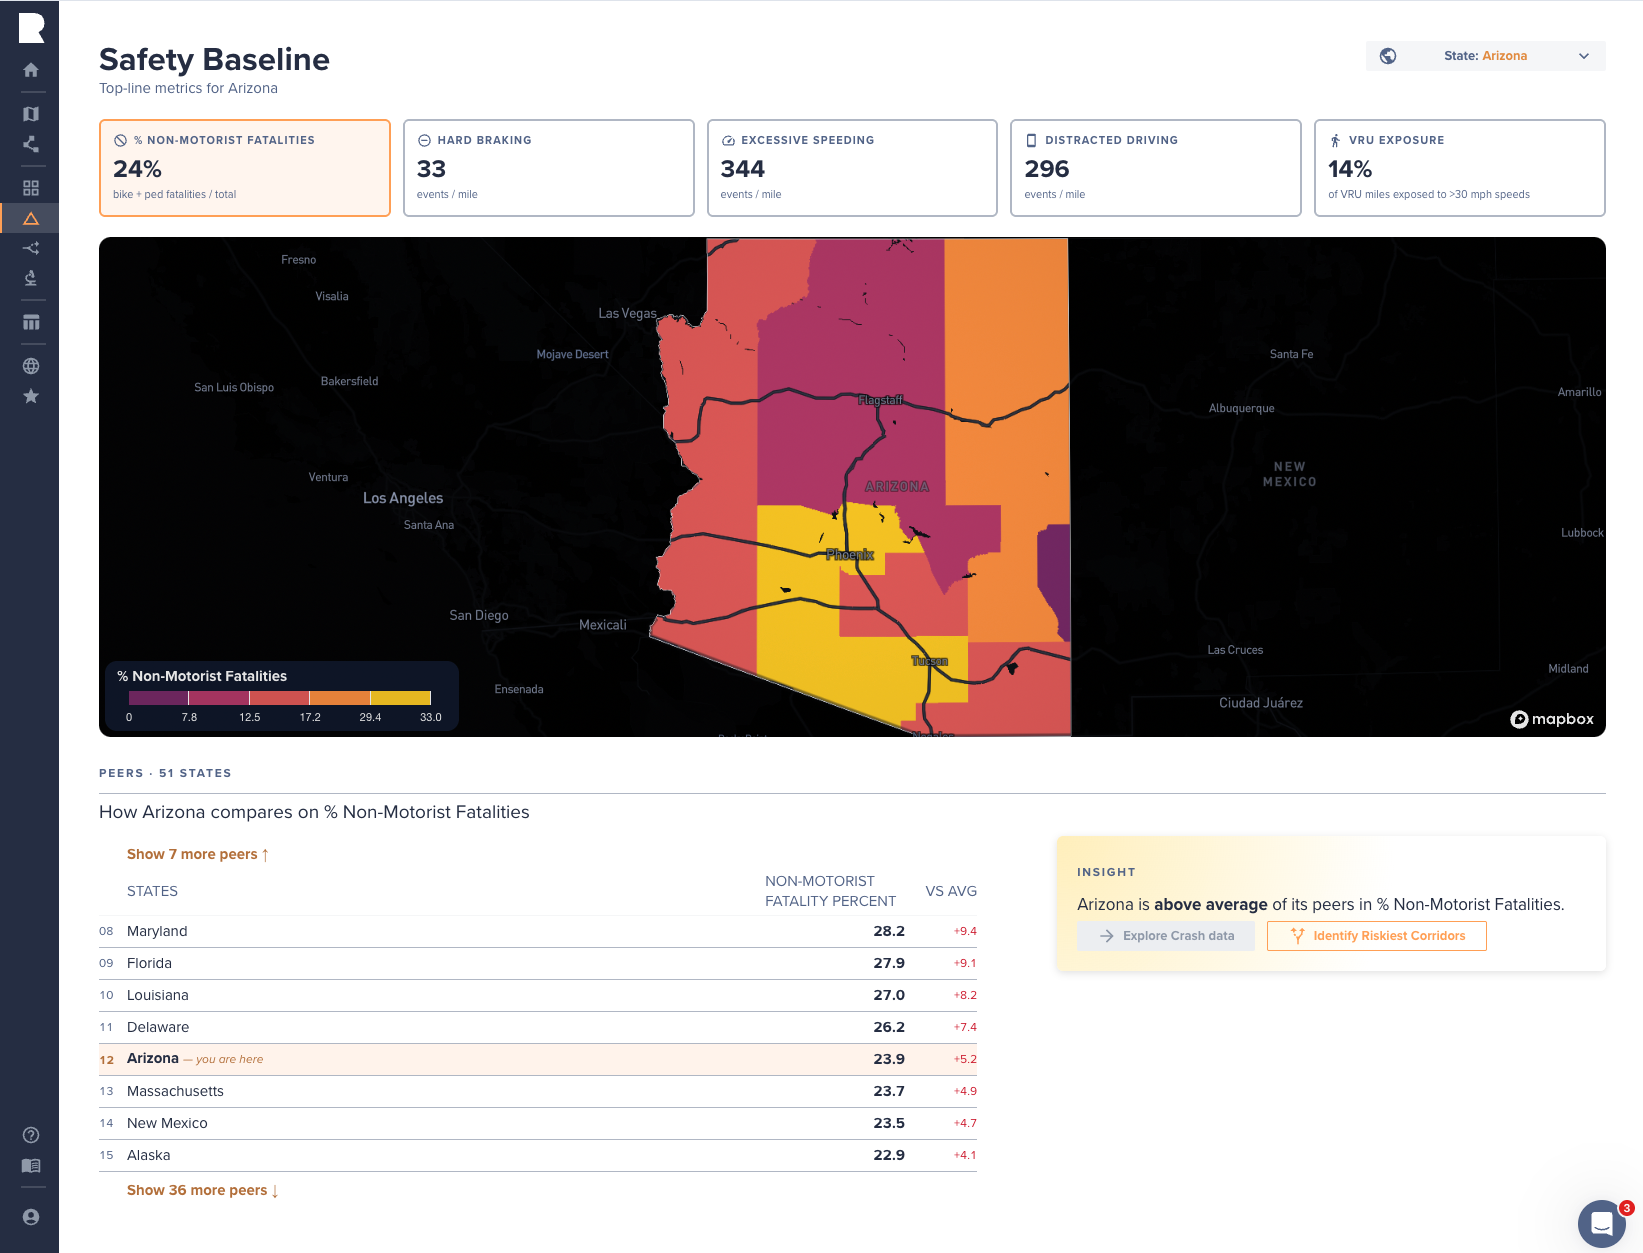
The Baseline tab provides a top-line snapshot of recent safety conditions for the selected geography. Five metrics are surfaced as selectable cards at the top of the page:
- % Non-Motorist Fatalities — Bicyclist and pedestrian fatalities as a share of total traffic fatalities.
- Hard Braking — Daily average hard braking events per roadway mile.
- Excessive Speeding — Daily average excessive speeding events per roadway mile.
- Distracted Driving — Daily average phone-handling events per roadway mile.
- VRU Exposure — Share of bicyclist and pedestrian miles traveled along corridors with prevailing vehicle speeds of 30 mph or higher.
Selecting a metric updates the rest of the page to reflect that metric:
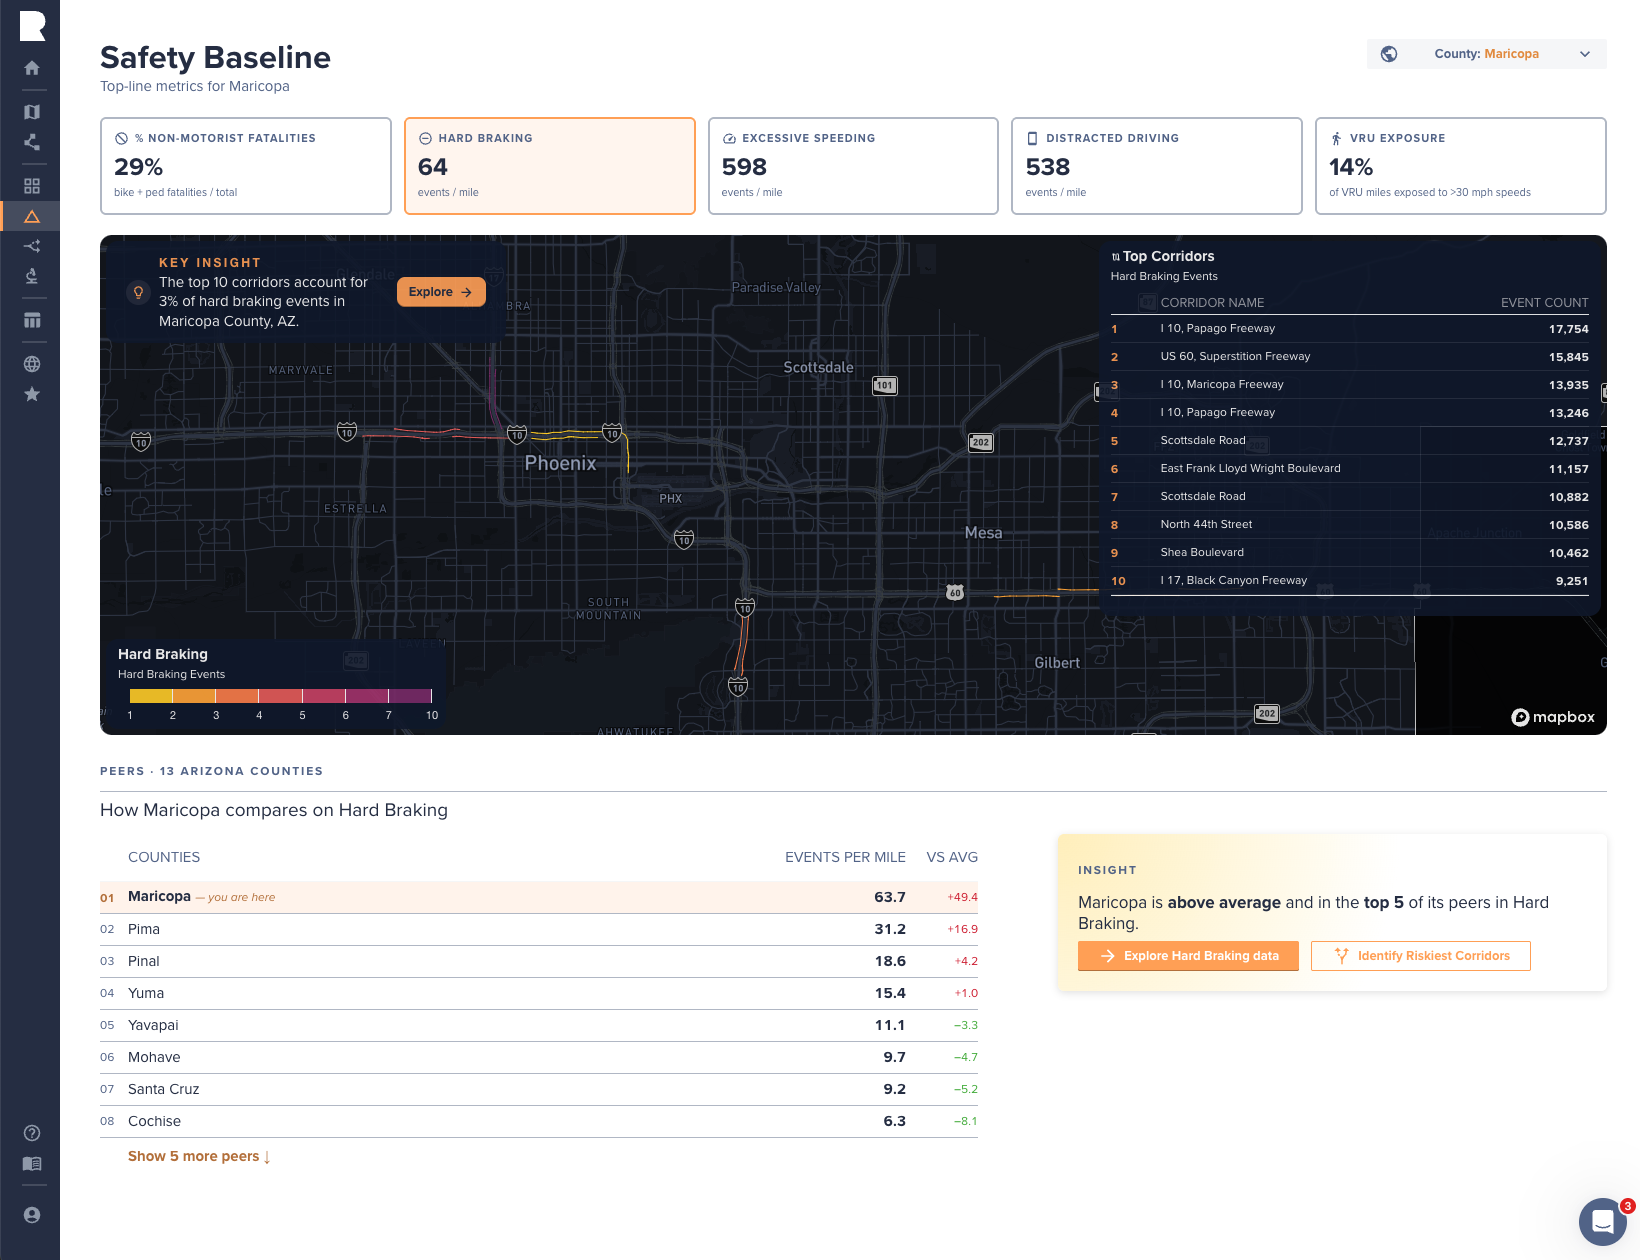
- Map View: Visualizes the selected metric across the geography. For state-level views, the map shows the metric across counties. For county- and city-level views, the map highlights additional granular insights.
- Top Corridors: For counties and cities, a ranked list of the 10 riskiest corridors by the active metric is displayed alongside the map. State-level views surface county-level breakdowns instead.
- Peer Comparison: A ranked table comparing the selected geography against its peer group on the active metric, with delta indicators showing how far above or below the peer average the geography sits. An insight panel summarizes the comparison.
- Linked Actions: Each metric card provides two quick links: Explore [metric] data opens the corresponding Explore application (Crash Explorer, Events Explorer, or VRU Explorer); Identify Riskiest Corridors opens the Corridor Risk Screening application with the selected geography pre-selected as the risk profile.
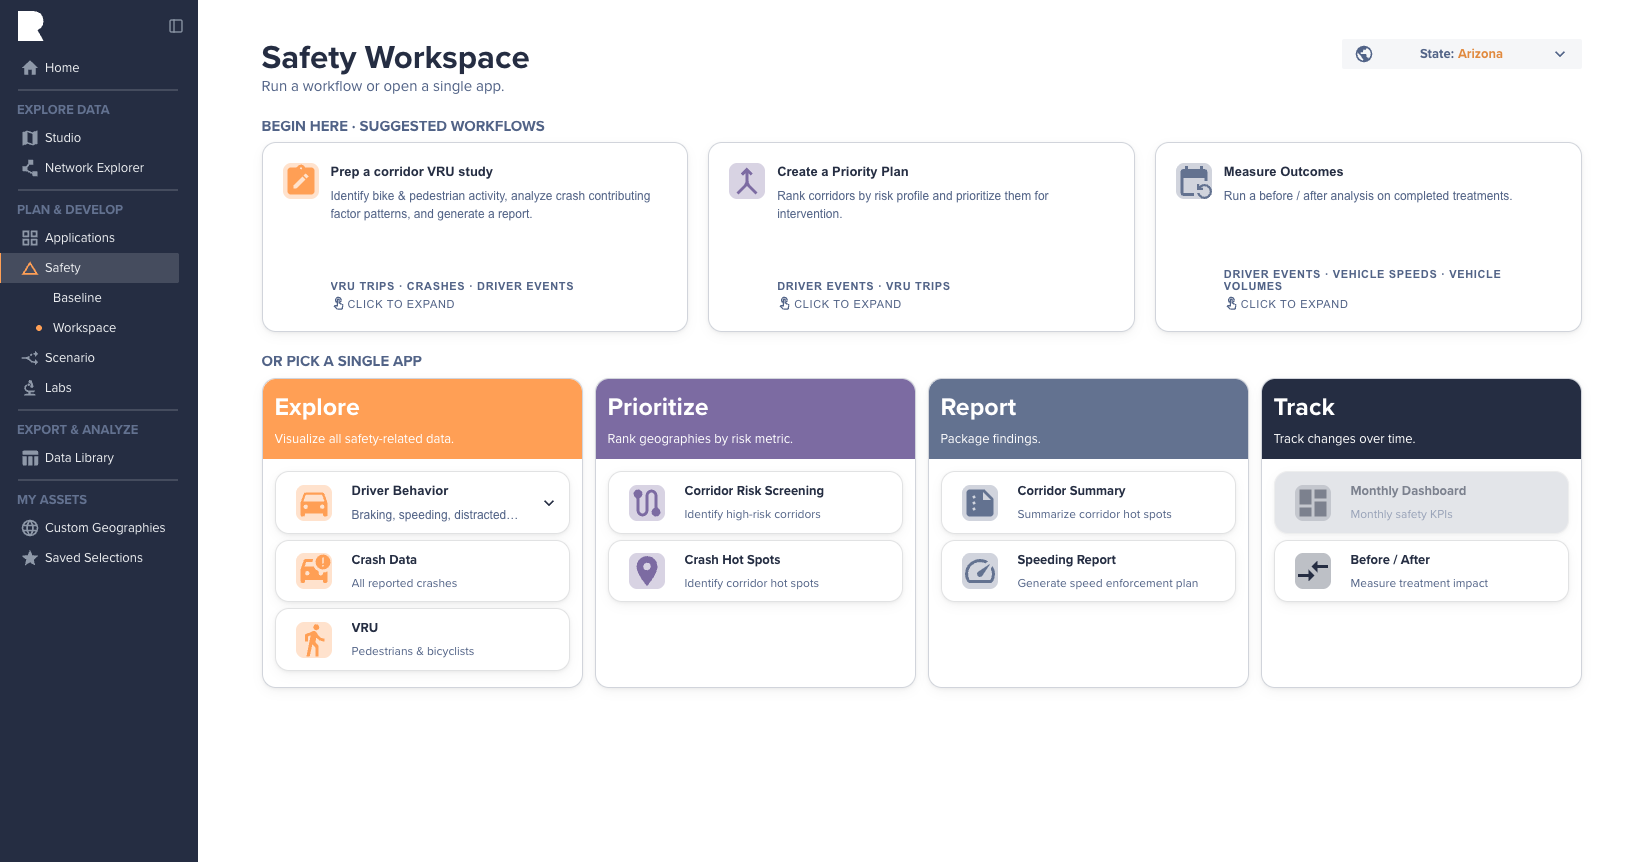
Workspace
The Workspace tab is the application launcher and workflow hub. It organizes all Safety Hub applications into four lanes by analytical purpose:
- Explore — Crash Data, Driver Behavior, VRU
- Prioritize — Corridor Risk Screening, Corridor Safety Analysis (generate hot spots)
- Report — Corridor Safety Analysis (summarize corridor hot spots), Speeding Report
- Track — Before / After
See the individual application methodologies linked below for full details on each app.
Methodology
Top-Line Metrics
Each Baseline metric is computed from a specific underlying data source and normalized for comparability across geographies:
- % Non-Motorist Fatalities: Bicyclist + pedestrian fatality count divided by total traffic fatality count for the selected geography. Sourced from the Fatality Analysis Reporting System (FARS) for calendar year 2024.
- Hard Braking, Excessive Speeding, Distracted Driving: Daily average event count divided by total roadway mileage in the geography. Sourced from Replica's driver behavior data for Fall 2025 (September–October 2025). See Driver Behavior Data Methodology for full details.
- VRU Exposure: Total bicyclist and pedestrian miles traveled on corridors with prevailing vehicle speeds of 30 mph or higher, divided by total bicyclist and pedestrian miles traveled. VRU trip volumes are sourced from Replica's seasonal trip tables for Fall 2025; observed vehicle speeds come from the driver behavior data. See Seasonal Mobility Model Methodology and Speed Data Methodology for full details.
Updated 21 days ago