
Corridor Risk Screening
Overview
The Corridors Risk Screening application automatically scans the roadway network and surfaces a prioritized list of high-risk corridors for any county or city with population above 30,000. For each jurisdiction, the tool evaluates all eligible corridors against a user-selected safety profile and returns a ranked, non-overlapping set of corridors representing the highest-risk segments distributed across the network.
Key Features:
- Automated scanning and evaluation of all eligible corridors in the network
- Choice of safety profile to align prioritization with intervention objectives
- User-configurable minimum corridor length
- Optional state road filter to scope the analysis
- Ranked output of non-overlapping corridors with relative risk benchmarking
- Grouping of nearby corridors into longer stretches of consistent risk
Dangerous Corridors in Action
The application includes the following components:
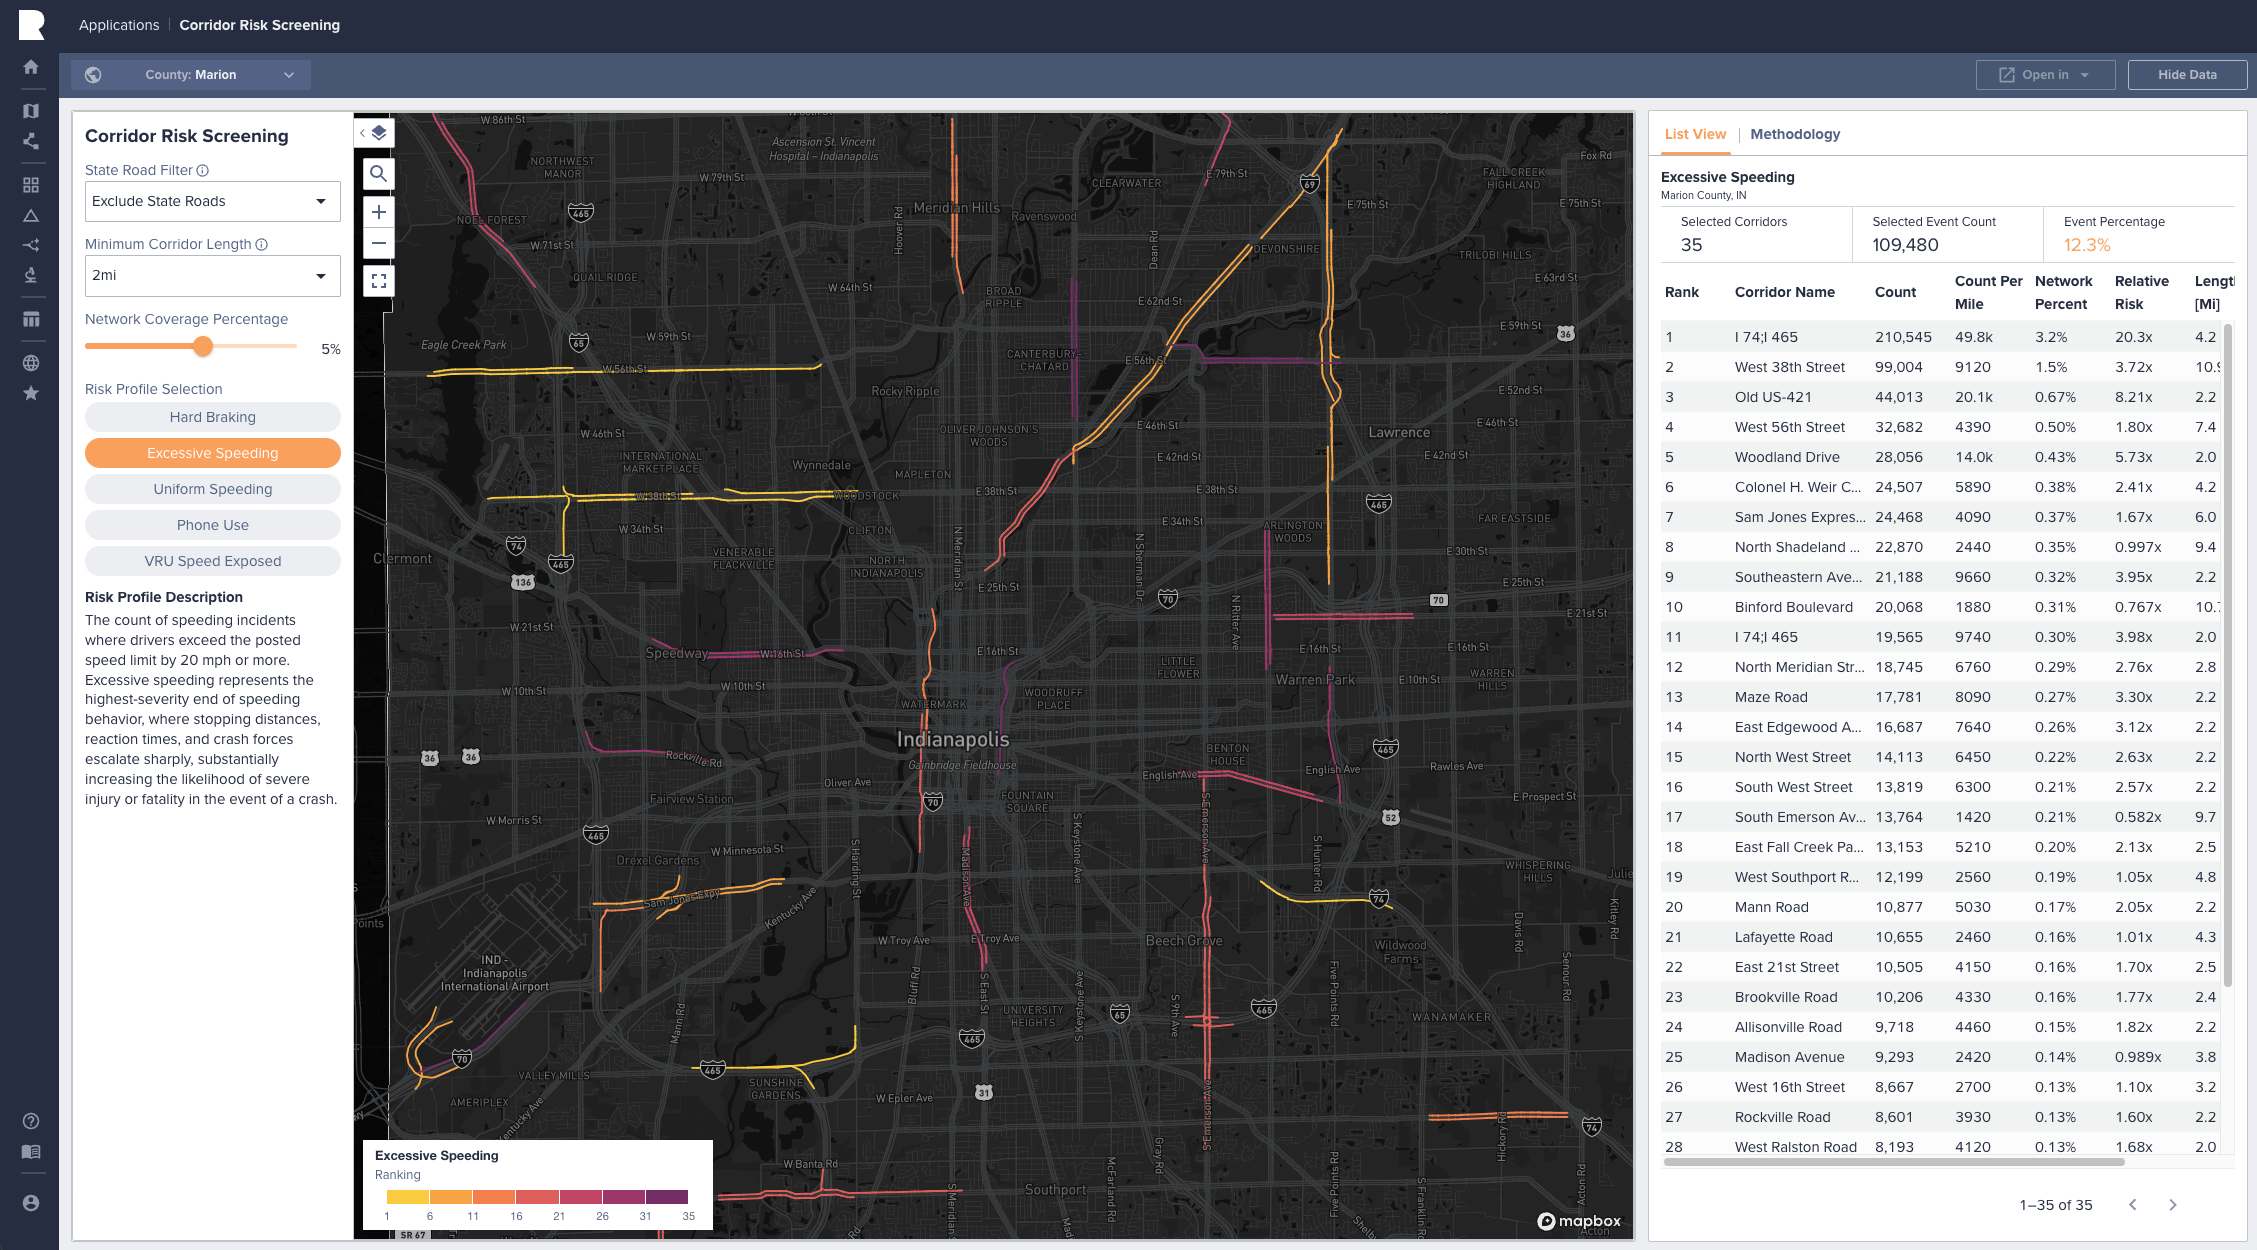
- Selection Controls: Choose a state, county, corridor length (0.5–3 miles), risk profile, and optional state road filter to scope the analysis. A description of the selected profile appears below the controls.
- Map View: Visualize the ranked, non-overlapping set of high-risk corridors for the selected jurisdiction and safety profile. Corridors are color-coded by rank.
- List View: Review a ranked table of corridors showing rank, corridor name, event count, percent of the county's total events occurring on the corridor, and a relative risk multiplier indicating how concentrated risk is on that corridor compared to the county baseline. Summary statistics report the total number of ranked corridors, total events on those corridors, and the share of county events they represent.
- Event Capture Slider: Adjust a slider to select the highest N% of combined corridor mileage (ranked by the active safety profile) and see the corresponding share of target events that falls on those corridors. This view supports Pareto-style analysis — for example, identifying that 5% of network mileage may account for a much larger share of risk events — and helps users size intervention footprints to a desired event-capture target.
Methodology
Safety Profiles
The application supports the following five safety profiles. Each represents a distinct dimension of corridor risk; users select the profile most aligned with their intervention priorities, and corridors are ranked accordingly.
- Hard Braking: The total count of hard braking events along the corridor. Hard braking is a strong behavioral indicator of risk as it reflects situations where drivers are forced into abrupt, reactive responses, whether due to unexpected traffic, poor sight lines, or roadway design issues that catch drivers off guard.
- Distracted Driving: The count of phone handling while driving incidents along the corridor. Distracted driving is a well-documented contributor to crash risk; a driver engaging with their phone, even briefly, experiences a significant reduction in situational awareness and reaction time.
- Speeding: The expected count of speeding incidents per corridor. Speeding is one of the most consistent predictors of crash severity and injury outcome, a relationship that is well established in the road safety literature.
- Excessive Speeding: The count of speeding incidents where drivers exceed the posted speed limit by 20 mph or more. Excessive speeding represents the highest-severity end of speeding behavior, where stopping distances, reaction times, and crash forces escalate sharply, substantially increasing the likelihood of severe injury or fatality in the event of a crash.
- VRU Exposed to 30+ mph Speeds: The total miles traveled by bicyclists and pedestrians along corridors where prevailing vehicle speeds reach 30 mph or higher. This metric captures the exposure of vulnerable road users to traffic speeds at which the probability of severe or fatal injury in a crash rises sharply, a relationship well established in road safety research.
Corridor Definition
A corridor is defined as a continuous stretch of road meeting three criteria:
- Road Classification: The corridor must belong to a main road class as defined by OpenStreetMap: motorways, trunks, primary, secondary, or tertiary roads and their links.
- Length: Minimum corridor length is user-defined as one of 0.5, 1, 1.5, 2, 2.5, or 3 miles, with a ±0.2 mile buffer to allow for stretches slightly above or below the threshold. Corridors on the same street within 300 meters of one another are merged into a single corridor to identify longer stretches of consistent risk.
- No Sharp Turns: At every point along the corridor — whether an intersection or a curve — the change in direction must not exceed 45 degrees. A corridor may follow a gently winding road, but it cannot cross a sharp intersection turn or a sudden directional break that would mark a transition between two fundamentally different road environments.
State Road Filter
The State Road Filter scopes the analysis based on roadway designation. Three options are available:
- None (default): All eligible corridors are included.
- Only State Roads: Restricts the analysis to corridors composed of state-designated roadways.
- Exclude State Roads: Removes state-designated roadways from the analysis, retaining only local and non-state corridors.
State roads are identified as network links whose street names include state or interstate abbreviations (e.g., "KS", "I-", "SR").
Aggregation and Ranking
For every county and city with population above 30,000, the application aggregates the selected safety profile metric across all eligible corridors in the network and ranks them accordingly. The output is a ranked list of non-overlapping corridors representing the highest-risk segments in the jurisdiction.
The non-overlapping constraint is deliberate: it ensures that the output represents a geographically distributed set of high-risk segments across the jurisdiction, rather than a dense cluster of overlapping paths concentrated in a single area. This guarantees that the prioritization is meaningful at the network level, not just locally.
Updated 41 minutes ago